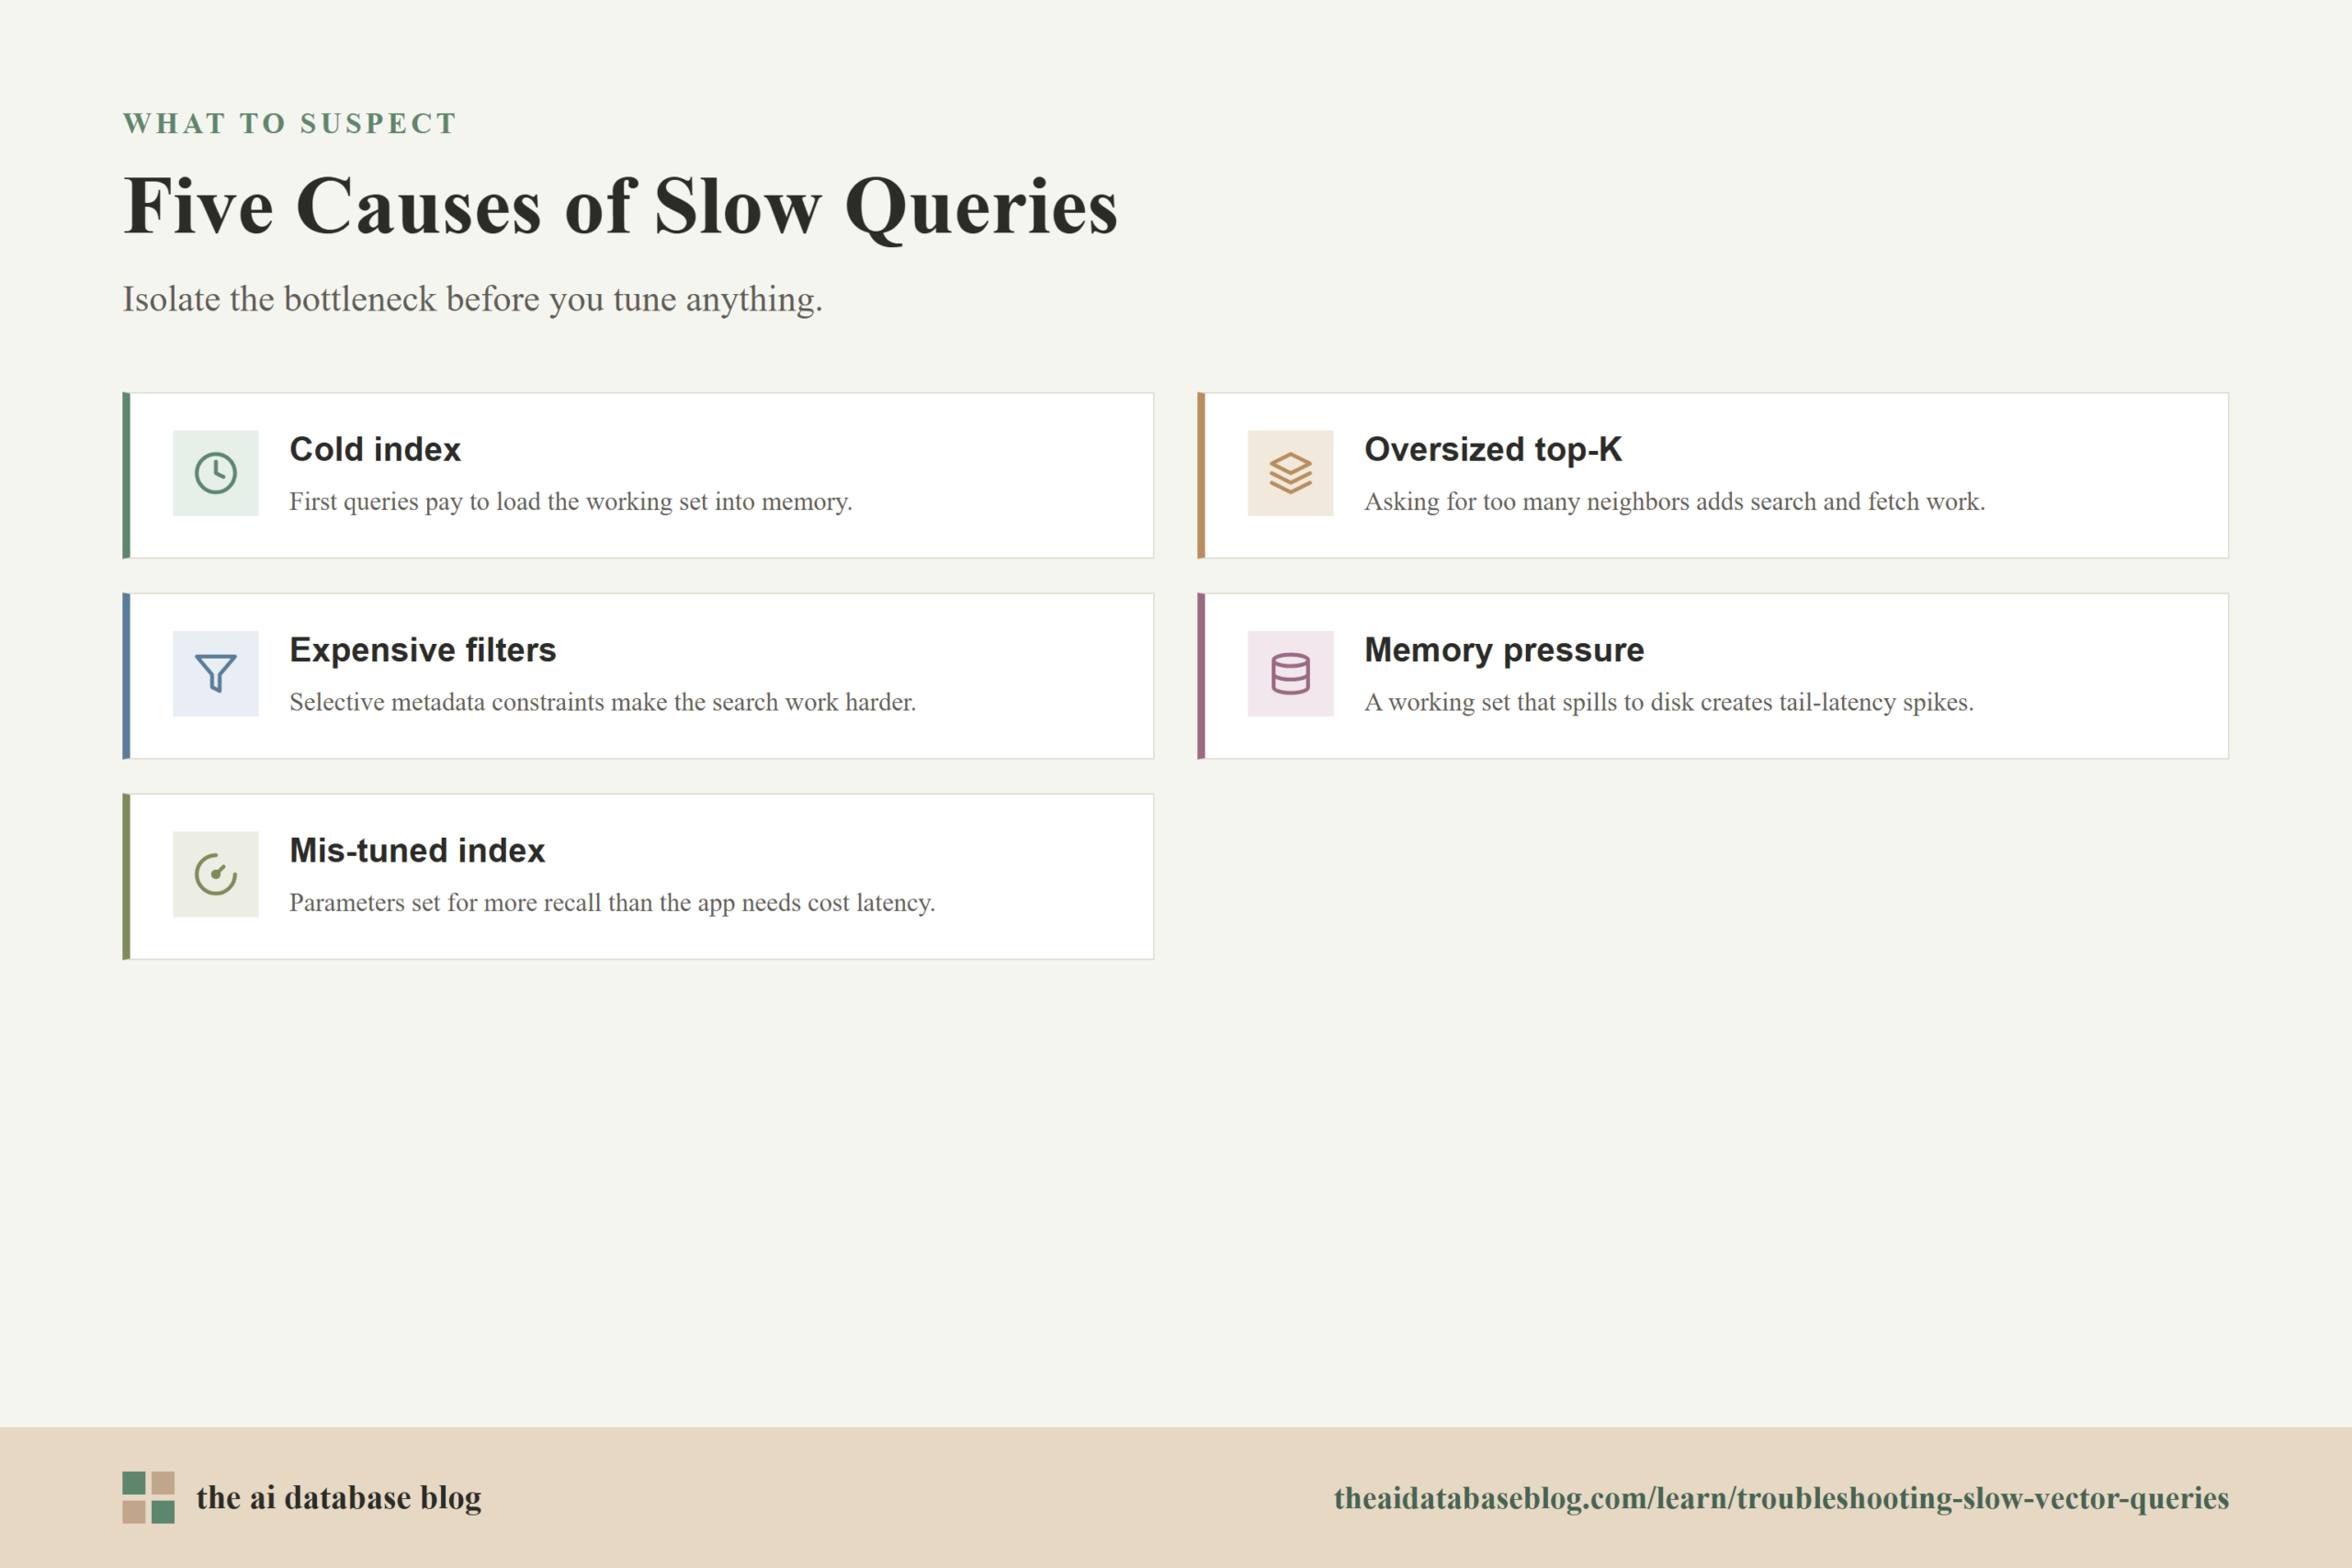
Slow vector queries usually come from a small set of causes: a cold index, a top-K value that asks the system to return too many neighbors, filters that force expensive candidate selection, memory pressure that pushes the index or vectors out of fast memory, or index parameters that are tuned for the wrong balance of latency and recall. The fastest way to fix the problem is to measure each part of the query path separately, compare slow queries against healthy queries, and change one factor at a time so you can see whether latency improves without damaging relevance.
This guide explains how to diagnose the most common sources of vector query latency and what to do about each one. It covers how cold indexes behave, why oversized top-K requests can make retrieval slower than expected, how metadata filters affect vector search, what memory pressure looks like in production, and how index parameters can either improve or hurt performance depending on the workload.
Start With The Shape Of The Query
Before changing the database, start by describing the query that is slow. A vector query is not only a nearest-neighbor search. In most AI applications, it may include embedding generation, request routing, vector index traversal, metadata filtering, score calculation, document fetching, reranking, and network response time. If all of those steps are measured as one number, it is difficult to know whether the vector index is actually the problem.
A useful first step is to split the latency into stages. Measure how long it takes to create the query embedding, how long the database spends on the search itself, how long filters or payload retrieval take, and how long the application spends after results return. Then compare p50, p95, and p99 latency rather than looking only at the average. A system can look healthy on average while a small number of tail-latency queries are painfully slow.
Also capture the query inputs that tend to be slow. Record the top-K value, filter predicates, namespace or collection, vector dimension, index type, result payload size, and whether the query is hybrid, filtered, reranked, or exact. This gives you a baseline for debugging. Without that baseline, teams often tune index parameters when the real problem is a filter, a payload fetch, or a cold cache.
Once the query shape is visible, the next step is to check whether the slowdown happens only after idle periods, restarts, deployments, or index reloads. That pattern points to a cold index, which behaves differently from a permanently overloaded system.
Diagnosing A Cold Index
A cold index is an index that has not yet loaded the working set it needs into memory or cache. The first queries after a restart, scale event, deployment, compaction, shard movement, or long idle period may pay extra cost because the system must read index pages, graph nodes, compressed vector blocks, metadata, or document payloads from slower storage. In disk-backed or memory-mapped systems, this can show up as a sharp p95 or p99 spike even when later queries are fast.
The easiest signal is a latency pattern that improves after repeated queries. If the first few queries against a collection are slow, but the same query becomes faster after the index has been touched, the system is likely warming memory, file-system cache, or an internal vector cache. You may also see higher disk reads, page faults, or CPU stalls during the slow period.
How To Diagnose It
Compare the first query after a restart or idle window with the tenth or twentieth query against the same collection. If latency drops consistently, treat the issue as a warmup problem before you treat it as an index quality problem. Also check whether only some shards or partitions are slow. A single cold shard can make the whole request slow if the query fans out across partitions and waits for the slowest response.
Cold-index diagnosis is strongest when you can correlate query spikes with operational events. Look for recent deployments, node replacements, index rebuilds, scaling changes, maintenance windows, or storage tier transitions. If slow queries appear after those events and fade after traffic resumes, the index is not necessarily misconfigured. It may simply need a planned warmup path.
How To Fix It
Use warmup queries after restarts, deployments, and scaling events. The warmup workload does not need to reproduce every user query, but it should touch the collections, partitions, filter fields, and vector indexes that production traffic will use. If your system supports cache pinning, index preloading, or keeping frequently queried collections in memory, use those features for latency-sensitive workloads.
You can also reduce the effect of cold starts by separating hot and cold data. Recent, frequently queried, or business-critical vectors can live in a low-latency tier, while older or rarely queried vectors can be searched with looser latency expectations. For RAG systems, this may mean keeping the most active knowledge base indexes warm while letting archival content use a slower path.
A cold index explains why the same query can be slow at one moment and fast a few minutes later. If the query is slow even after warmup, the next likely cause is that the query is asking for too many results or too much downstream work.
Diagnosing Oversized Top-K
Top-K is the number of nearest neighbors the query asks the database to return. A request for the top 5 results is very different from a request for the top 500 results. Larger top-K values often require the search algorithm to keep more candidates, compare more vectors, apply more filters, fetch more payloads, and return more data across the network. Even if the index traversal itself is efficient, a large top-K can increase both search time and post-processing time.
Oversized top-K is common in AI applications because teams try to compensate for uncertain relevance by retrieving a large pool and then trimming results later. That approach can be reasonable for offline evaluation or reranking experiments, but it can become expensive in production. A retrieval system should ask for enough candidates to support the user experience, not an arbitrary large number chosen for safety.
How To Diagnose It
Run the same query with several top-K values, such as 5, 10, 25, 50, and 100, while keeping filters and index settings constant. Plot latency and relevance side by side. If latency rises quickly while relevance gains flatten, the top-K value is larger than the application needs. Also check how much time is spent fetching full records. Returning 100 small identifiers is not the same as returning 100 large text chunks with metadata.
Look for queries where top-K is inflated because a later step discards many results. For example, an application might request 200 vector matches, apply permission filtering in the application layer, then rerank the remaining documents and show only 5. That may hide a filtering or access-control problem behind what appears to be a vector search latency problem.
How To Fix It
Set top-K based on measured recall and the needs of the next stage. If a reranker needs 30 candidates to produce good final results, requesting 300 may add latency without improving the answer. If a chatbot only cites 4 passages, it may still need more than 4 retrieved chunks, but the right number should come from evaluation rather than guesswork.
Separate candidate count from displayed count. The system might retrieve 30 candidates, rerank 10, and show 4. That is different from retrieving hundreds of documents on every request. If filters or permissions remove many candidates, move those constraints earlier in the query path where possible, or use a larger candidate pool only for the specific filtered cases that need it.
Top-K tuning usually gives quick wins because it changes the amount of work per query directly. If top-K is already reasonable and latency is still high, the next thing to inspect is whether filters are making the search path more expensive than expected.
Diagnosing Expensive Filters
Metadata filters make vector search more useful because they let the system search only within the relevant part of the data. A user may want results from a specific tenant, language, document type, time range, permission group, product category, or region. The tradeoff is that filters change the candidate set. They can make the database visit more nodes, scan more metadata, or return fewer usable matches from an approximate search.
Filtered vector search is especially sensitive to selectivity. A broad filter that matches 80 percent of the collection behaves very differently from a narrow filter that matches 0.1 percent. The relationship between the filter and the vector space also matters. If the matching vectors are clustered near each other, the search may stay efficient. If they are scattered across the graph or partitions, the database may need more work to find enough good matches.
How To Diagnose It
Compare the same vector query with no filter, with a broad filter, and with a highly selective filter. If unfiltered search is fast but filtered search is slow, the index is probably not the only issue. Measure filter selectivity, which is the percentage of records that pass the filter. Also check whether the filter field has the right indexing support for the database you are using.
Pay attention to the filter execution strategy. Some systems pre-filter, meaning they restrict the data before vector search. Some post-filter, meaning they search first and discard non-matching results afterward. Others combine filtering and vector traversal. Pre-filtering can preserve result completeness but may add work for large datasets or complex predicates. Post-filtering can be faster in some cases, but it may return too few results when the filter is selective and top-K is small.
How To Fix It
Start by simplifying expensive predicates. Replace complex, high-cardinality, or nested application logic with indexed metadata fields that the database can evaluate efficiently. For common filters such as tenant, language, visibility, or document type, make sure those fields are modeled as first-class filter fields rather than buried in unindexed payloads.
For very common filter patterns, consider partitioning or separate indexes. If most queries are scoped to a tenant, workspace, product area, or language, a single global index plus a selective filter may be slower than a design that narrows the search space earlier. The right choice depends on data size and query distribution: too many partitions can create operational overhead, while too few can make filters expensive.
When post-filtering is used, increase the internal candidate pool for filtered queries so enough results survive the filter, but do this carefully because it increases latency. When pre-filtering is used, watch for filters that match a large portion of the dataset and may be slower than a less restrictive search path. The best fix is often not a single setting, but a query plan that adapts to filter selectivity.
Filters can make a fast index look slow because they change what the search is allowed to return. If filters are tuned and the query is still slow under load, the next likely cause is resource pressure, especially memory pressure.
Diagnosing Memory Pressure
Vector indexes are memory-hungry because they store embeddings, graph or tree structures, quantized representations, metadata, and sometimes cached payloads. HNSW-style graph indexes, for example, often use additional memory for neighbor connections. If the working set does not fit comfortably in memory, queries may wait on disk reads, page faults, garbage collection, cache churn, or background compaction. The result is usually unstable latency rather than one clean slowdown.
Memory pressure often appears as tail latency. Average latency may stay acceptable while p95 and p99 climb. This happens because some queries hit hot memory while others touch cold pages, overloaded shards, or large payloads. It can also appear when ingestion, deletes, compaction, or index building happen at the same time as user queries.
How To Diagnose It
Watch memory usage, cache hit rate, page faults, disk read latency, CPU steal or throttling, and garbage collection if the database runtime exposes it. Compare query latency during quiet periods with latency during ingestion or index maintenance. If slow queries correlate with high memory utilization or storage reads, index tuning alone will not solve the problem.
Also check whether the result payload is too large. Some systems retrieve full document chunks, metadata, and stored fields as part of the vector query response. If the vector search itself is fast but payload retrieval is slow, reduce returned fields, fetch only document identifiers first, or move large content retrieval into a second step for the final selected results.
How To Fix It
Reduce the working set or add capacity. This can mean scaling memory, reducing vector dimensions, using quantization where acceptable, separating hot and cold data, shrinking returned payloads, or removing unused metadata from the fast query path. If the database supports disk-based vector indexes, use them with realistic latency expectations and measure the effect of cache hit rates.
Control background work. Heavy ingestion, rebuilds, compaction, and deletes can compete with queries for memory and I/O. For latency-sensitive applications, schedule large maintenance tasks during lower-traffic windows or use separate resources for indexing and serving when the architecture supports it.
Memory pressure is a capacity and data-layout problem as much as a query problem. Once the working set fits the performance target, index parameter tuning becomes more predictable because the system is no longer fighting storage and cache churn.
Diagnosing Mis-Tuned Index Parameters
Approximate nearest neighbor indexes are built around tradeoffs. They reduce latency by avoiding a full scan of every vector, but they need parameters that control how much of the index is explored and how much structure is built. If those parameters are too aggressive, recall may suffer. If they are too conservative, latency may rise. A slow query can therefore be a sign that the index is tuned for more recall than the application needs, or that poor build settings force the query to work harder than it should.
For HNSW-style indexes, common parameters include the number of graph connections, often called M; the construction effort used when building the graph; and the search effort used at query time, often called efSearch or a similar name. Larger search effort usually improves recall but increases latency. More graph connections can improve navigability and recall, but they also increase memory use and build cost. Other index families have different names, such as probes, lists, leaves, or beam width, but the tradeoff is similar.
How To Diagnose It
Build a small evaluation set with representative queries and known good results. Then test latency and recall across parameter values instead of tuning by intuition. If increasing search effort improves recall only slightly while latency rises sharply, the search parameter may be too high for production. If recall is weak even with high search effort, the build-time settings, vector quality, distance metric, or data model may be the deeper issue.
Compare filtered and unfiltered behavior. A parameter value that works for unfiltered search may fail when filters are added because the search must find enough qualified vectors, not just nearby vectors. This is why filtered workloads should be included in evaluation. Do not tune only on clean, unfiltered benchmark queries if production traffic almost always includes metadata constraints.
How To Fix It
Tune query-time search effort against a target recall and latency budget. Start with the database default, then test lower and higher values using real queries. For latency-sensitive user experiences, choose the lowest setting that meets relevance requirements. For high-stakes retrieval, choose a setting that protects recall even if it costs more latency.
If build-time parameters are too weak, rebuild the index with stronger construction settings or more suitable graph connectivity. This can be more disruptive than changing a query-time parameter, but it may be necessary when the index structure itself is poor. Also verify that the distance metric matches the embedding model and that vectors are normalized when the chosen metric expects it.
For filtered or hybrid workloads, consider adaptive settings. A broad, unfiltered query may run well with a lower search effort, while a highly selective filtered query may need a larger candidate pool or different filter strategy. The goal is not to find one magical parameter value. The goal is to match settings to the workload while keeping the relevance-latency tradeoff visible.
Index tuning is the last major category because it only makes sense after query shape, filters, memory, and cold-start behavior are understood. With all five causes in view, you can use a practical troubleshooting sequence instead of guessing.
A Practical Troubleshooting Sequence
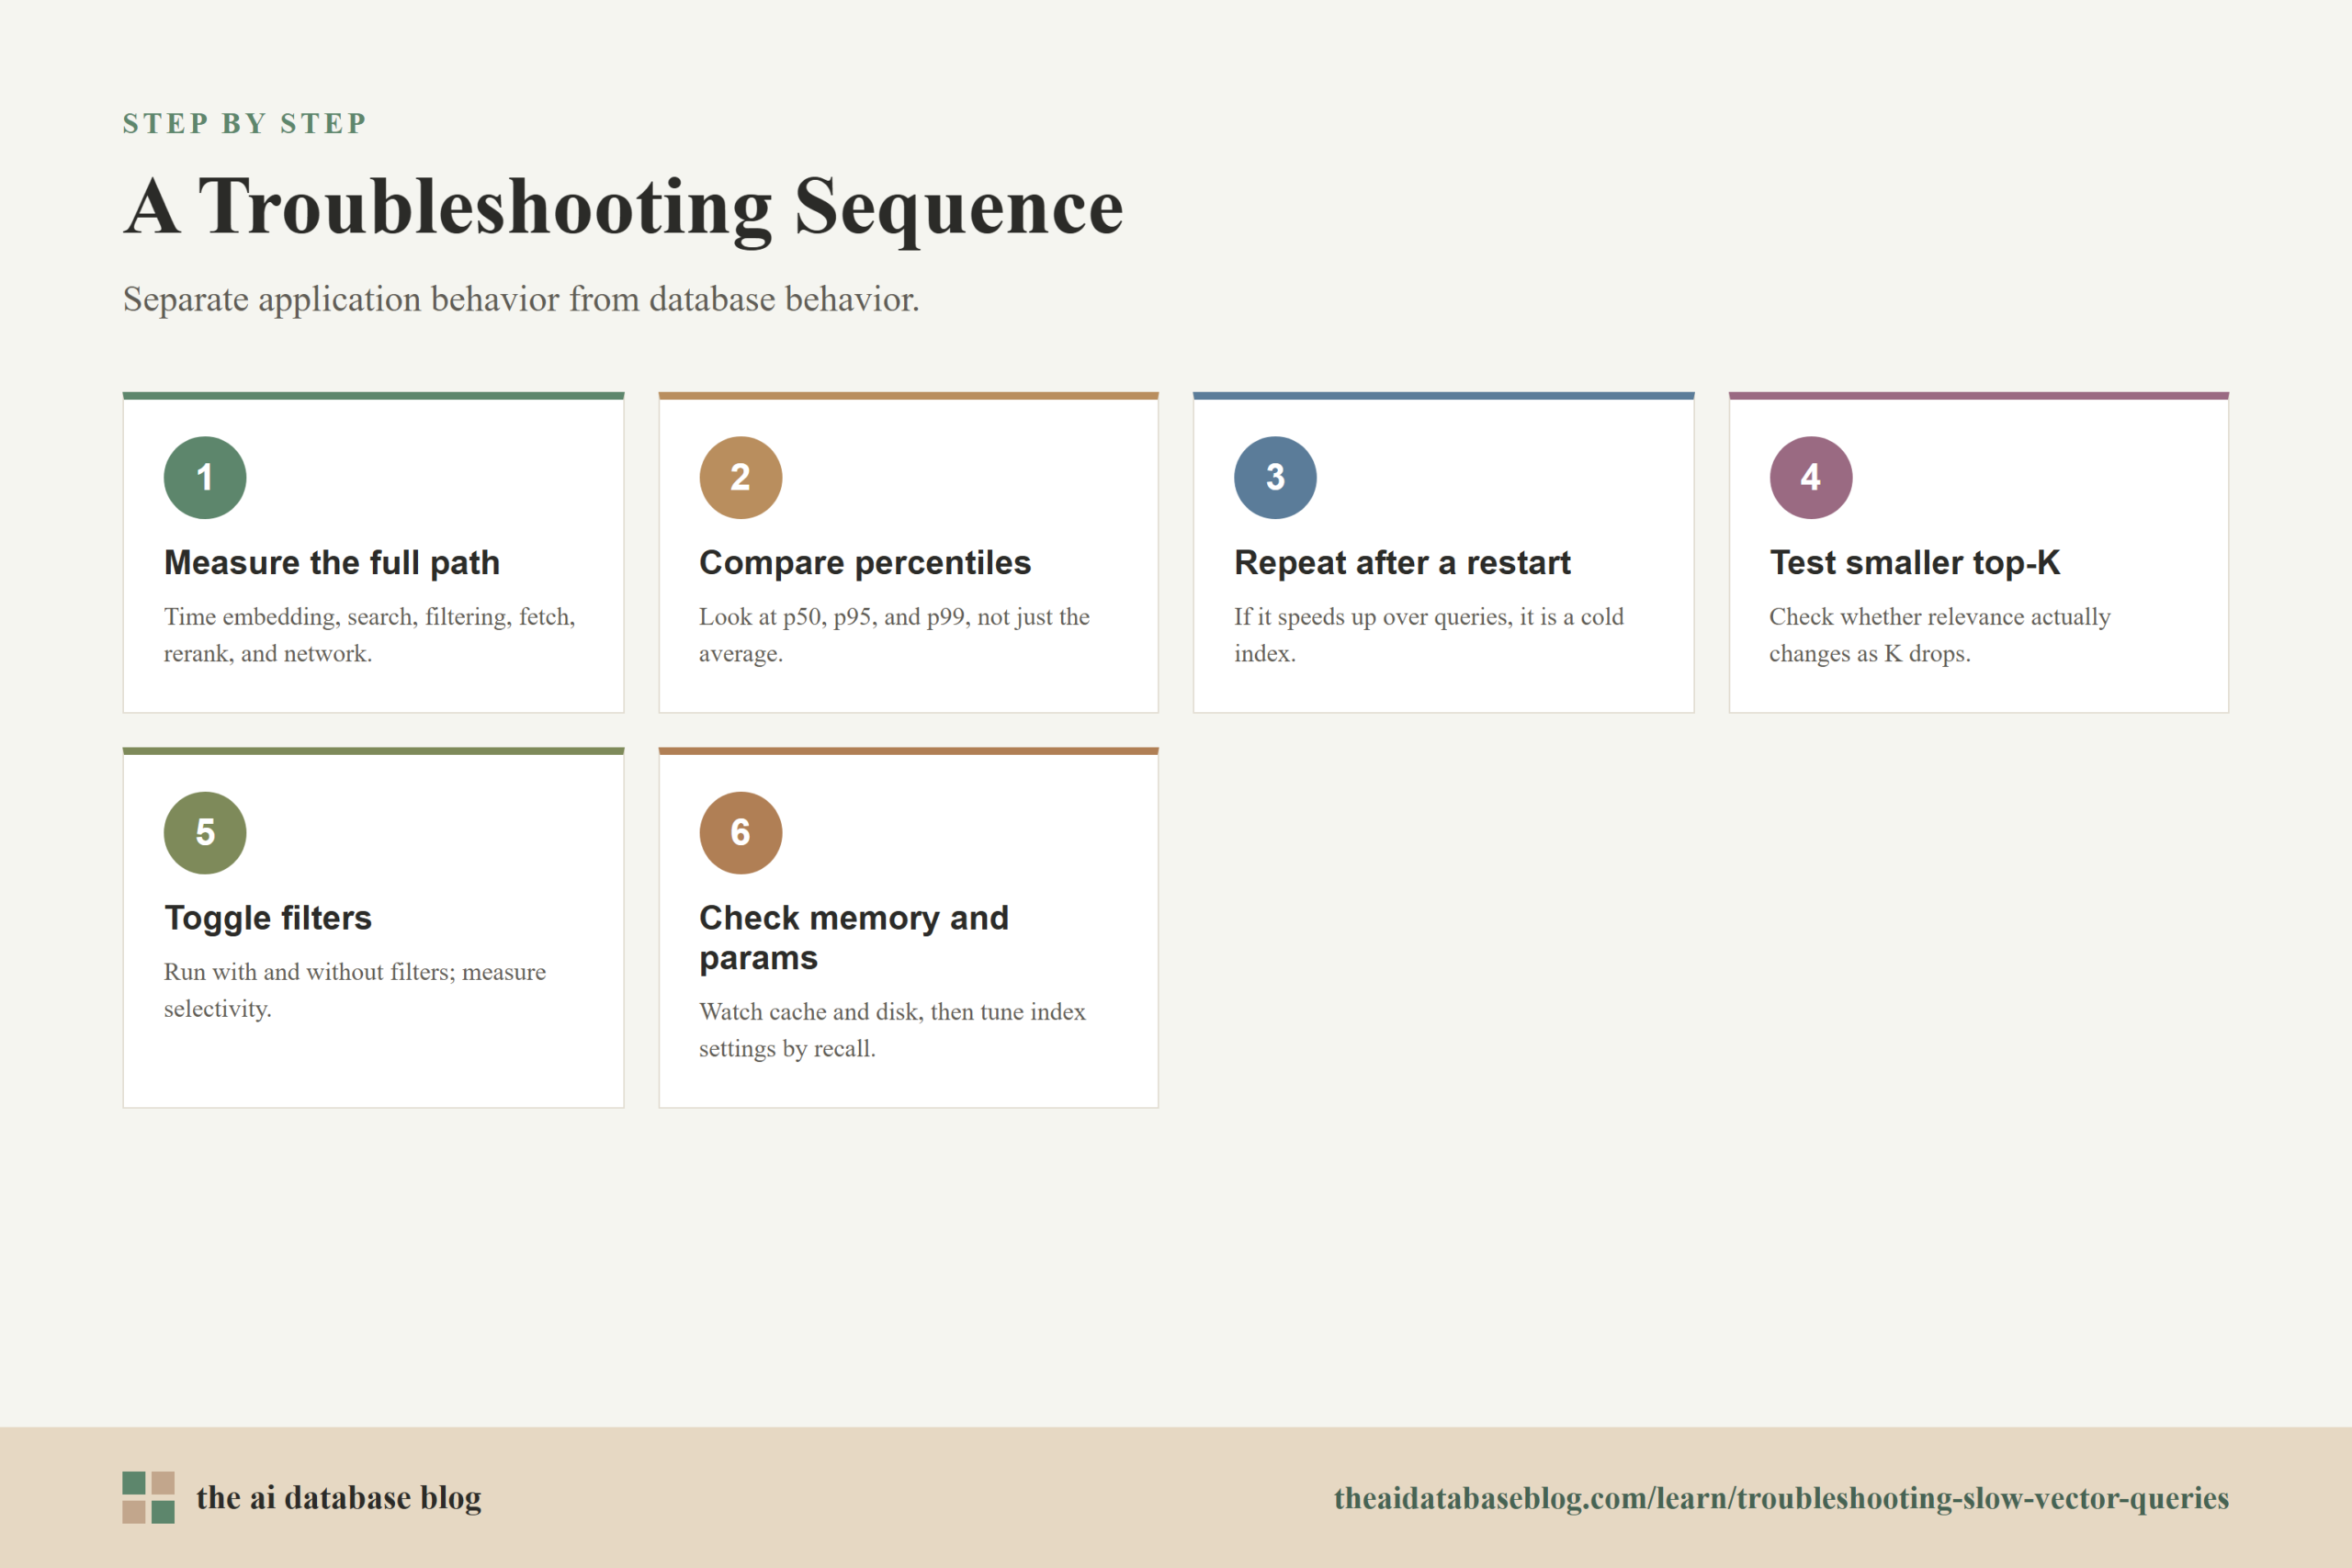
When vector queries are slow, work through the causes in an order that separates application behavior from database behavior. Start with measurement, then isolate whether the slowdown is caused by warmup, query size, filters, memory, or index settings. This order prevents wasted tuning and makes it easier to explain why a fix worked.
- Measure the full request path, including embedding generation, vector search, filtering, payload fetch, reranking, and network time.
- Compare p50, p95, and p99 latency so tail-latency problems are visible.
- Repeat the same query after a restart or idle period to check for cold-index behavior.
- Test smaller top-K values and measure whether relevance actually changes.
- Run the query with and without filters, then measure filter selectivity and result completeness.
- Check memory, cache, disk, and background indexing activity during slow queries.
- Evaluate index parameters against representative filtered and unfiltered queries.
The safest fixes are the ones that reduce unnecessary work without changing relevance: warming hot indexes, lowering oversized top-K, returning smaller payloads, indexing filter fields properly, and separating hot data from cold data. Parameter changes can also be powerful, but they should be validated with recall measurements so a faster query does not quietly become a worse query.
After the immediate slowdown is fixed, the next question is how to keep it from returning. That requires ongoing measurement, not just one-time tuning.
How To Prevent Slow Vector Queries From Coming Back
Vector query performance changes as data grows, filters become more complex, embeddings change, and traffic patterns shift. A configuration that works for 100,000 vectors may not work for 10 million vectors. A top-K value that was harmless before reranking may become expensive after larger payloads are added. Treat vector search as a system that needs regular evaluation rather than a static feature that stays tuned forever.
Track latency by query type, not only at the service level. Separate unfiltered vector search, filtered vector search, hybrid search, permission-scoped search, and reranked search. Each category has different bottlenecks. Also track recall or relevance metrics so performance improvements do not come from simply doing less useful retrieval.
Finally, keep a small benchmark set that reflects production traffic. Include common filters, rare filters, high-value queries, multilingual queries if relevant, and queries from different tenants or data segments. Run it before index rebuilds, embedding model changes, schema changes, and major traffic growth. This turns troubleshooting from emergency guesswork into routine maintenance.
FAQs
1. Why are my first vector queries after a restart slow?
The most likely cause is a cold index. The database may need to load index pages, graph nodes, vector blocks, metadata, or payloads into memory before it can serve queries quickly. Warmup queries, index preloading, and keeping hot collections in memory can reduce this startup penalty.
2. Does a larger top-K always make vector search slower?
A larger top-K usually increases work because the system must keep, rank, filter, fetch, and return more candidates. The exact impact depends on the index, filters, payload size, and query plan. The practical fix is to test latency and relevance at several top-K values and choose the smallest value that supports the application.
3. Why do metadata filters make vector queries slower?
Filters change which vectors are eligible to return. If a filter is highly selective or difficult to evaluate, the database may need to search harder to find enough matching neighbors. Depending on the system, pre-filtering, post-filtering, or inline filtering can affect both latency and result completeness.
4. How can I tell whether memory pressure is the bottleneck?
Look for high memory utilization, low cache hit rates, page faults, disk reads, storage latency, or slowdowns during ingestion and maintenance. If p95 or p99 latency spikes while average latency looks acceptable, memory pressure or cache churn may be affecting only some queries.
5. Which index parameter should I tune first?
For many HNSW-style indexes, query-time search effort is the easiest parameter to test because it can often be changed without rebuilding the index. Increase it when recall is too low, and decrease it when latency is too high and relevance remains acceptable. Build-time parameters and graph connectivity require more care because they may require rebuilding the index.
6. Should I use exact search instead of approximate vector search for slow queries?
Exact search can be useful for small datasets, highly selective filters, or evaluation benchmarks, but it often becomes too expensive as the number of vectors grows. Approximate search is usually preferred for larger collections because it reduces the number of vectors examined, but it must be tuned and evaluated against recall requirements.
Takeaway
Troubleshooting slow vector queries is easiest when you separate the causes: cold indexes need warmup, oversized top-K values need tighter candidate counts, expensive filters need better modeling and execution, memory pressure needs capacity or working-set reduction, and mis-tuned index parameters need measured recall-latency tuning. This guidance is most useful for teams building RAG, semantic search, recommendation, or AI retrieval systems where latency and relevance both matter. A practical use case is a support chatbot that must retrieve accurate passages quickly: by measuring each stage and fixing the true bottleneck, the system can stay responsive without sacrificing answer quality.