Recall and QPS only become useful when they are read together. In vector search benchmarks, higher recall usually means the system does more work per query, while higher QPS usually means the system answers more queries by doing less work, using more hardware, accepting lower recall, or changing workload assumptions. A single recall, latency, or throughput number is not enough to judge an AI database because the practical question is where the system lands on the trade-off curve for your dataset, query pattern, concurrency level, and service-level agreement.
This guide explains why isolated benchmark numbers are easy to misread, how to interpret the recall-versus-QPS curve, and how to choose an operating point that matches a real application SLA. By the end, you should be able to look at a vector database benchmark and ask sharper questions about quality, latency, throughput, filtering, hardware, and production fit.
Why Recall and QPS Matter in AI Database Benchmarks
AI database benchmarks often focus on approximate nearest neighbor search, the technique many vector databases use to find similar embeddings quickly without comparing every vector in the database. Recall measures how many of the true nearest neighbors the system returned. QPS, or queries per second, measures how many search requests the system can handle over a period of time. Together, they describe a central production tradeoff: how much answer quality the system preserves while serving requests at speed.
For example, recall@10 asks how many of the true top 10 nearest neighbors appear in the returned top 10 results. If a search returns 9 of the true 10 nearest neighbors, the recall@10 for that query is 90 percent. Across many benchmark queries, recall is usually averaged so the result represents overall search quality rather than one lucky or unlucky query.
QPS is about throughput, not the experience of a single user. A system might report high QPS because it can run many concurrent queries, because the benchmark uses a small return size, or because the data is fully cached in memory. That does not automatically mean every individual query is fast enough for an interactive application. For that, latency percentiles matter, especially p95 and p99 latency.
Once recall and QPS are separated this way, the benchmark becomes easier to read. Recall tells you whether search quality is being preserved. QPS tells you whether the system can carry the request volume. Latency tells you whether individual users or downstream services will wait too long. The next mistake to avoid is treating any one of these measurements as meaningful on its own.
Why a Single Recall or Latency Number Is Meaningless
A single benchmark number is usually a point taken from a much larger performance surface. It hides the parameters, workload, hardware, concurrency, dataset, query distribution, and result size that produced the result. This is why a claim such as “99 percent recall” or “10,000 QPS” is not enough to evaluate an AI database. The number may be accurate in the benchmark and still be irrelevant to your production workload.
Recall is especially easy to misread because it depends on the definition of ground truth and the value of k. Recall@10 and recall@100 are not interchangeable. A retrieval-augmented generation system that sends the top 8 passages to a language model may care about recall@8 or recall@10, while a recommendation system that reranks 200 candidates may care about recall@100 or recall@200. The same index configuration can look strong at one k value and weaker at another.
Latency can be just as misleading when it is reported as a mean or median only. Average latency may look healthy even when a small percentage of requests are slow enough to break the user experience. For production services, p95 and p99 latency are often more useful because they show what happens near the tail of the distribution, where overloaded nodes, cache misses, large filters, or uneven query difficulty can appear.
QPS also needs context. A benchmark can increase throughput by lowering recall, reducing the number of returned results, using more CPU cores, avoiding metadata filters, warming caches, or testing with a query mix that is simpler than production traffic. None of those choices are wrong, but they change what the number means. High QPS at low recall may be useful for a coarse candidate-generation stage, but it may be unacceptable for a legal, medical, support, or compliance retrieval workflow where missing the right document is expensive.
So the first rule of reading benchmarks is simple: do not ask whether the number is impressive. Ask what tradeoff produced it. Once you make that shift, the benchmark stops being a leaderboard and starts becoming a map of possible operating choices.
How to Read the Recall-versus-QPS Trade-Off Curve
A recall-versus-QPS curve shows how search quality changes as throughput changes. In most approximate vector search systems, the curve slopes downward: as recall goes up, QPS tends to go down. That happens because higher recall usually requires the search algorithm to examine more candidate vectors, explore more graph nodes, probe more partitions, perform more reranking, or use less aggressive compression. More work per query usually means fewer queries can be served per second on the same hardware.
The best part of the curve is usually the elbow. This is the region where a modest increase in work produces a meaningful gain in recall, but before the curve flattens and each additional point of recall becomes expensive. For many applications, the elbow is a better target than the absolute highest recall point because it balances relevance, speed, and cost more efficiently.
Reading the curve means comparing configurations at the same workload assumptions. A fair curve should hold constant the dataset, embedding dimensionality, distance metric, top-k value, hardware, concurrency pattern, filtering behavior, and payload size. If one point uses top 10 results and another uses top 100, or if one includes metadata filtering and another does not, they are not directly comparable.
It also helps to look for stability, not just peak throughput. A curve that reaches high QPS but has poor p99 latency may be risky for user-facing systems. A curve that looks slower but stays predictable under concurrency may be better for applications with strict response-time expectations. In practical terms, the best benchmark line is not always the one furthest to the right. It is the one that satisfies your quality target and your latency budget under conditions that resemble production.
Once you understand the curve, the next question is no longer “Which system has the highest QPS?” The better question is “Which configuration gives us enough recall at the latency and cost our application can actually tolerate?” That question leads directly to choosing an operating point.
What an Operating Point Means
An operating point is the specific configuration you choose for production after deciding how much recall, latency, throughput, and cost your application needs. It is the place on the trade-off curve where the system should run day to day. In vector search, the operating point may be controlled by index parameters, search-time parameters, hardware allocation, replication, caching, quantization, reranking, and the amount of metadata returned with each result.
For an HNSW-style index, a common search-time parameter controls how widely the graph is explored for each query. Increasing it usually improves recall because the search considers more candidates, but it also increases CPU work and latency. For an IVF-style index, increasing the number of probed partitions can improve recall while reducing throughput. For compressed or quantized indexes, reranking more candidates with full-precision vectors can improve quality while adding compute and memory access.
The operating point should be tied to the job the retrieval system performs. A conversational RAG application may need enough recall to retrieve the right supporting documents while keeping p99 latency low enough that the overall answer still feels responsive. A batch enrichment pipeline may accept higher latency if it improves recall. A recommendation system may prefer very high QPS for candidate generation, then rely on a separate reranker to recover precision later.
This is why there is no universal best operating point. The same database and index can be tuned differently for an internal search tool, a high-traffic product recommendation API, an agent memory system, or a compliance review workflow. The benchmark tells you what is possible. Your SLA tells you which point is useful.
Choosing that point requires translating business and product expectations into measurable retrieval constraints. The benchmark curve gives you the options, but the SLA tells you where the acceptable region begins and ends.
Matching the Operating Point to Your SLA
A service-level agreement should turn vague performance goals into measurable limits. For AI database search, the SLA should not say only that search must be “fast” or “accurate.” It should define the minimum recall target, the maximum acceptable latency percentile, the expected query volume, the concurrency pattern, the top-k result size, and any filtering or payload requirements that materially affect performance.
A practical retrieval SLA might include targets such as p99 vector search latency under 80 milliseconds, recall@10 above 95 percent against a representative evaluation set, sustained throughput of 500 QPS during peak traffic, and support for the metadata filters used in production. Those numbers are only examples. The important point is that the SLA should describe the combined requirement, not separate wishes.
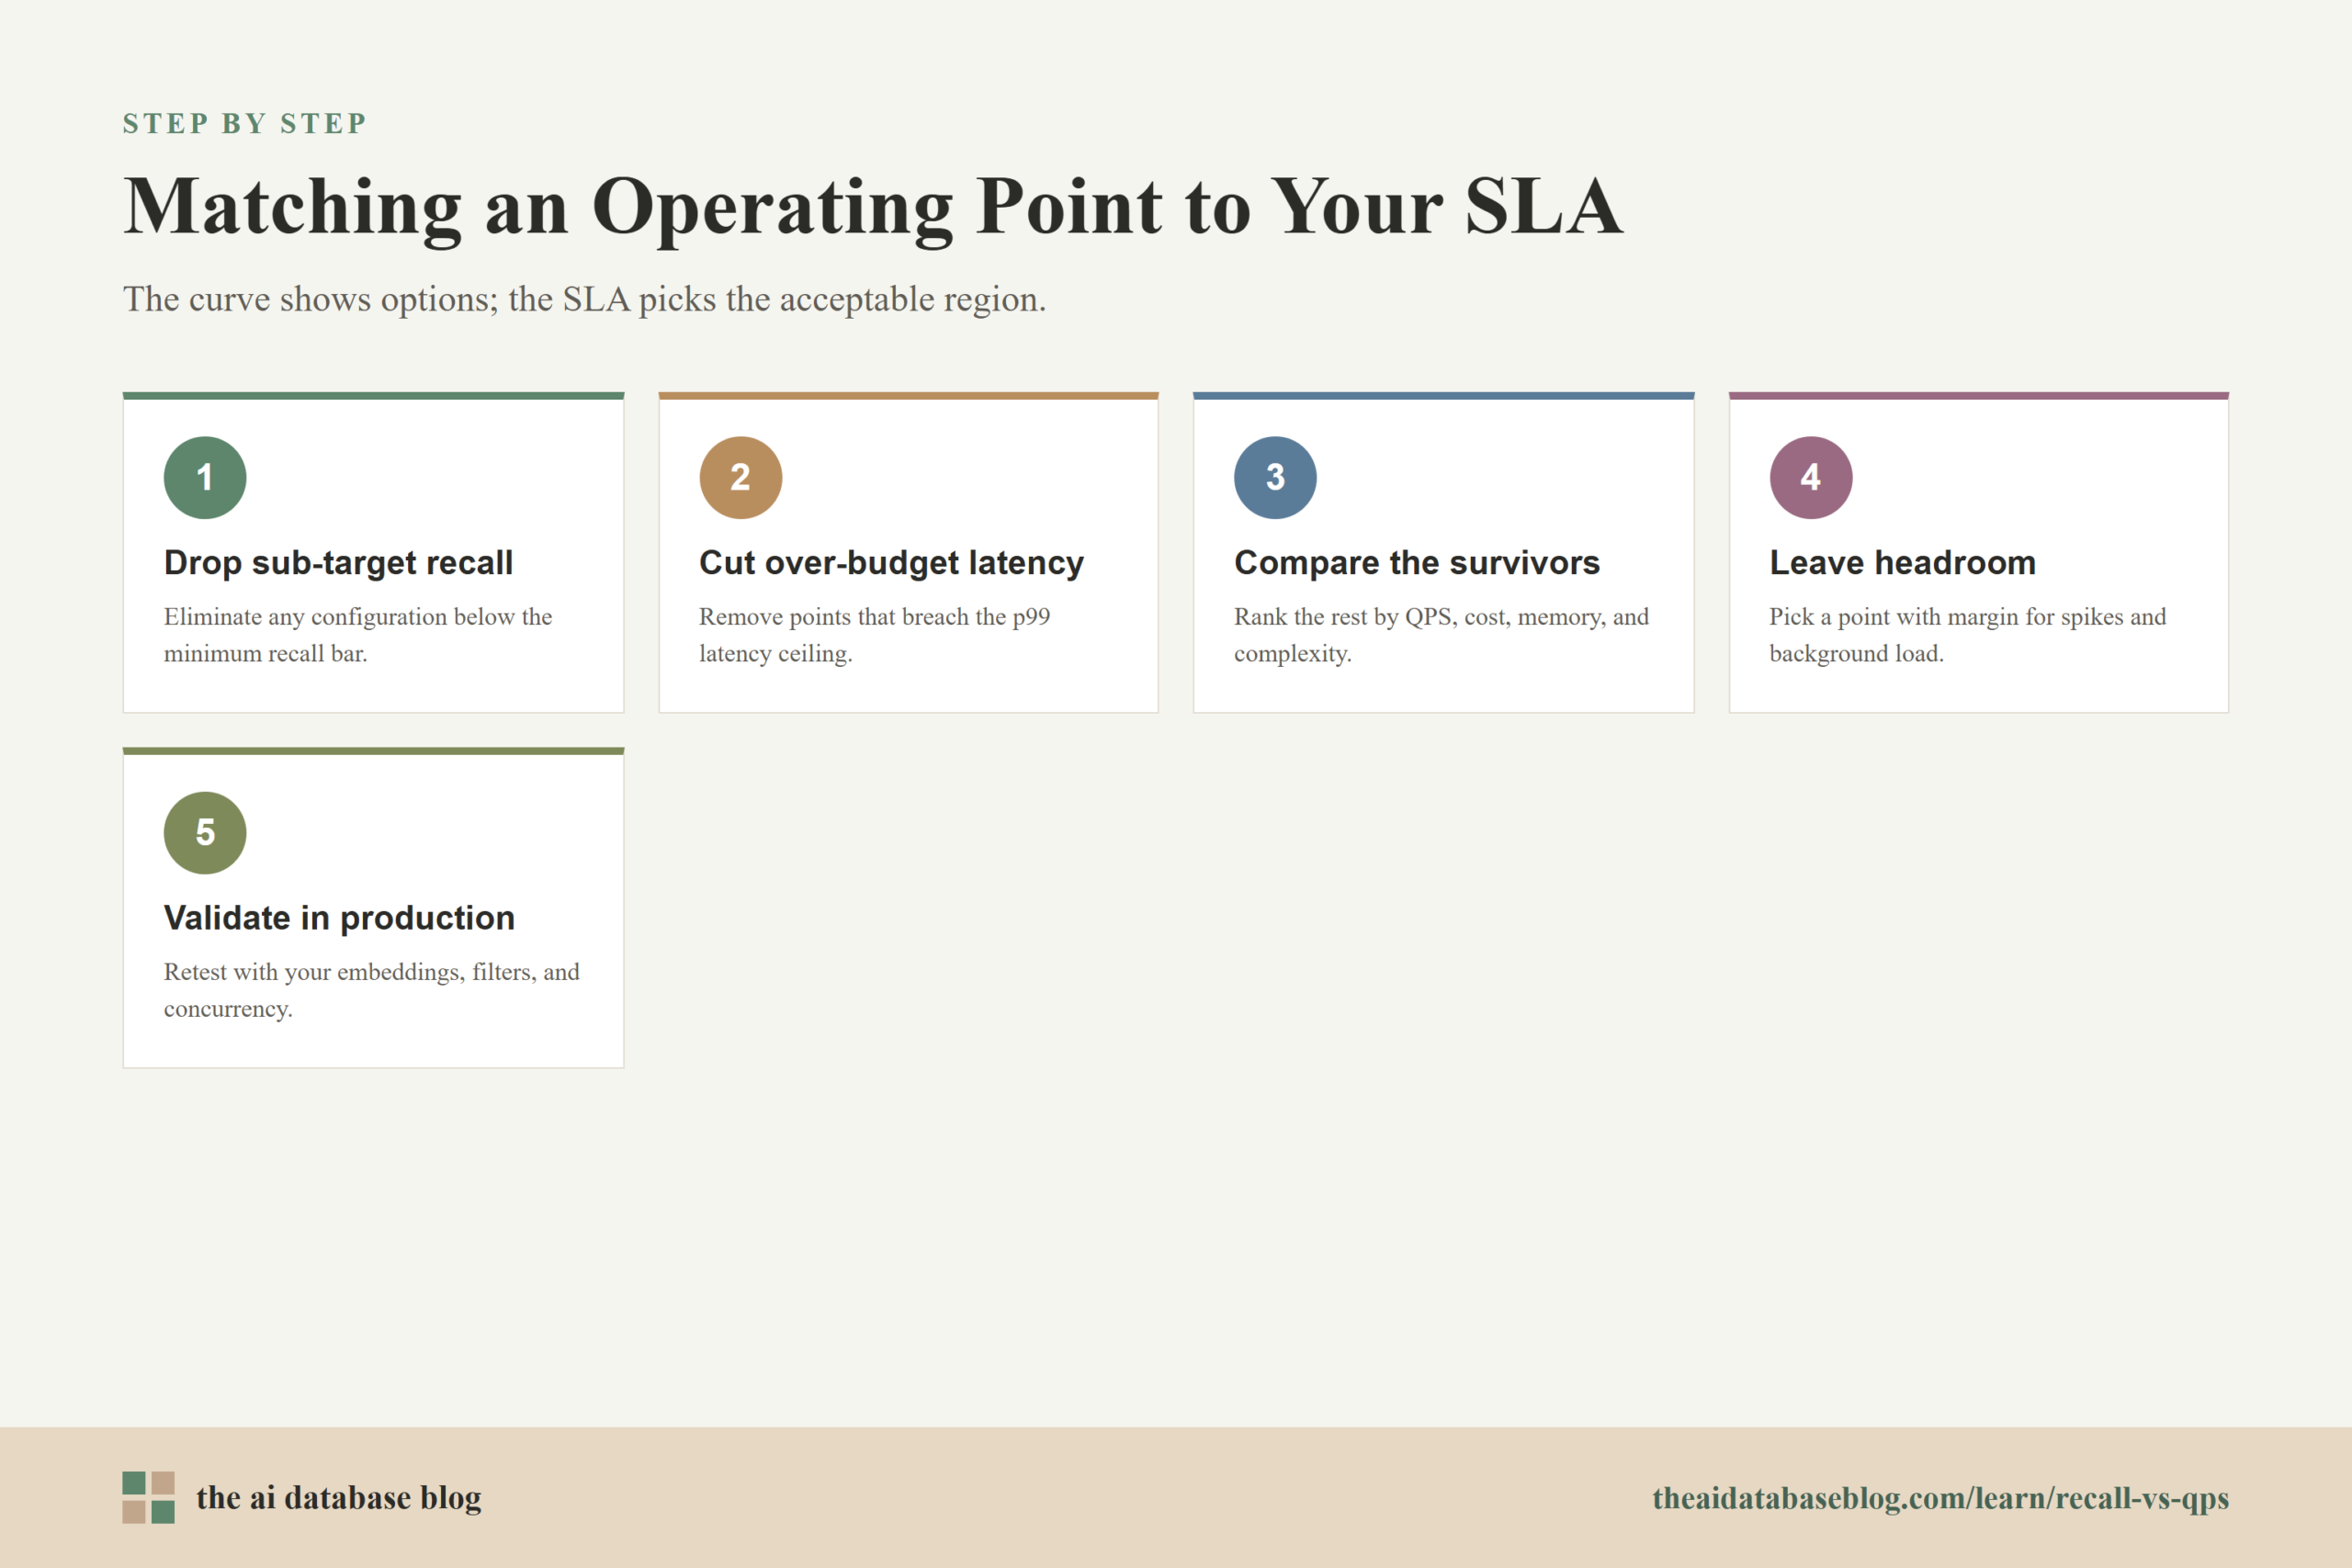
When matching a benchmark to an SLA, start by eliminating configurations that miss the recall target. If the application needs recall@10 of at least 95 percent, lower-recall points are not acceptable no matter how fast they are. Next, remove configurations that exceed the latency budget at the relevant percentile. Then compare the remaining options by QPS, hardware cost, memory use, indexing time, and operational complexity.
This order matters because a high-throughput system that misses the correct documents is not useful for quality-sensitive retrieval, and a high-recall system that violates the latency budget may break the user experience. The right operating point is the configuration that satisfies the minimum quality bar, stays inside the latency budget, and leaves enough throughput headroom for traffic spikes and background load.
After the benchmark suggests an operating point, validate it with production-like tests. Use the same embedding model, vector dimensions, filters, result sizes, metadata payloads, update patterns, and concurrency levels you expect in the real system. Public benchmarks are useful for orientation, but private workload tests are what determine whether the chosen point will hold up.
Benchmark Details That Change the Meaning of the Curve
Two benchmark curves can look similar while measuring very different things. Before trusting the shape of the curve, inspect the workload assumptions behind it. AI database performance is sensitive to data distribution, vector dimensionality, filter selectivity, index freshness, memory pressure, network overhead, and the amount of object data returned with each match.
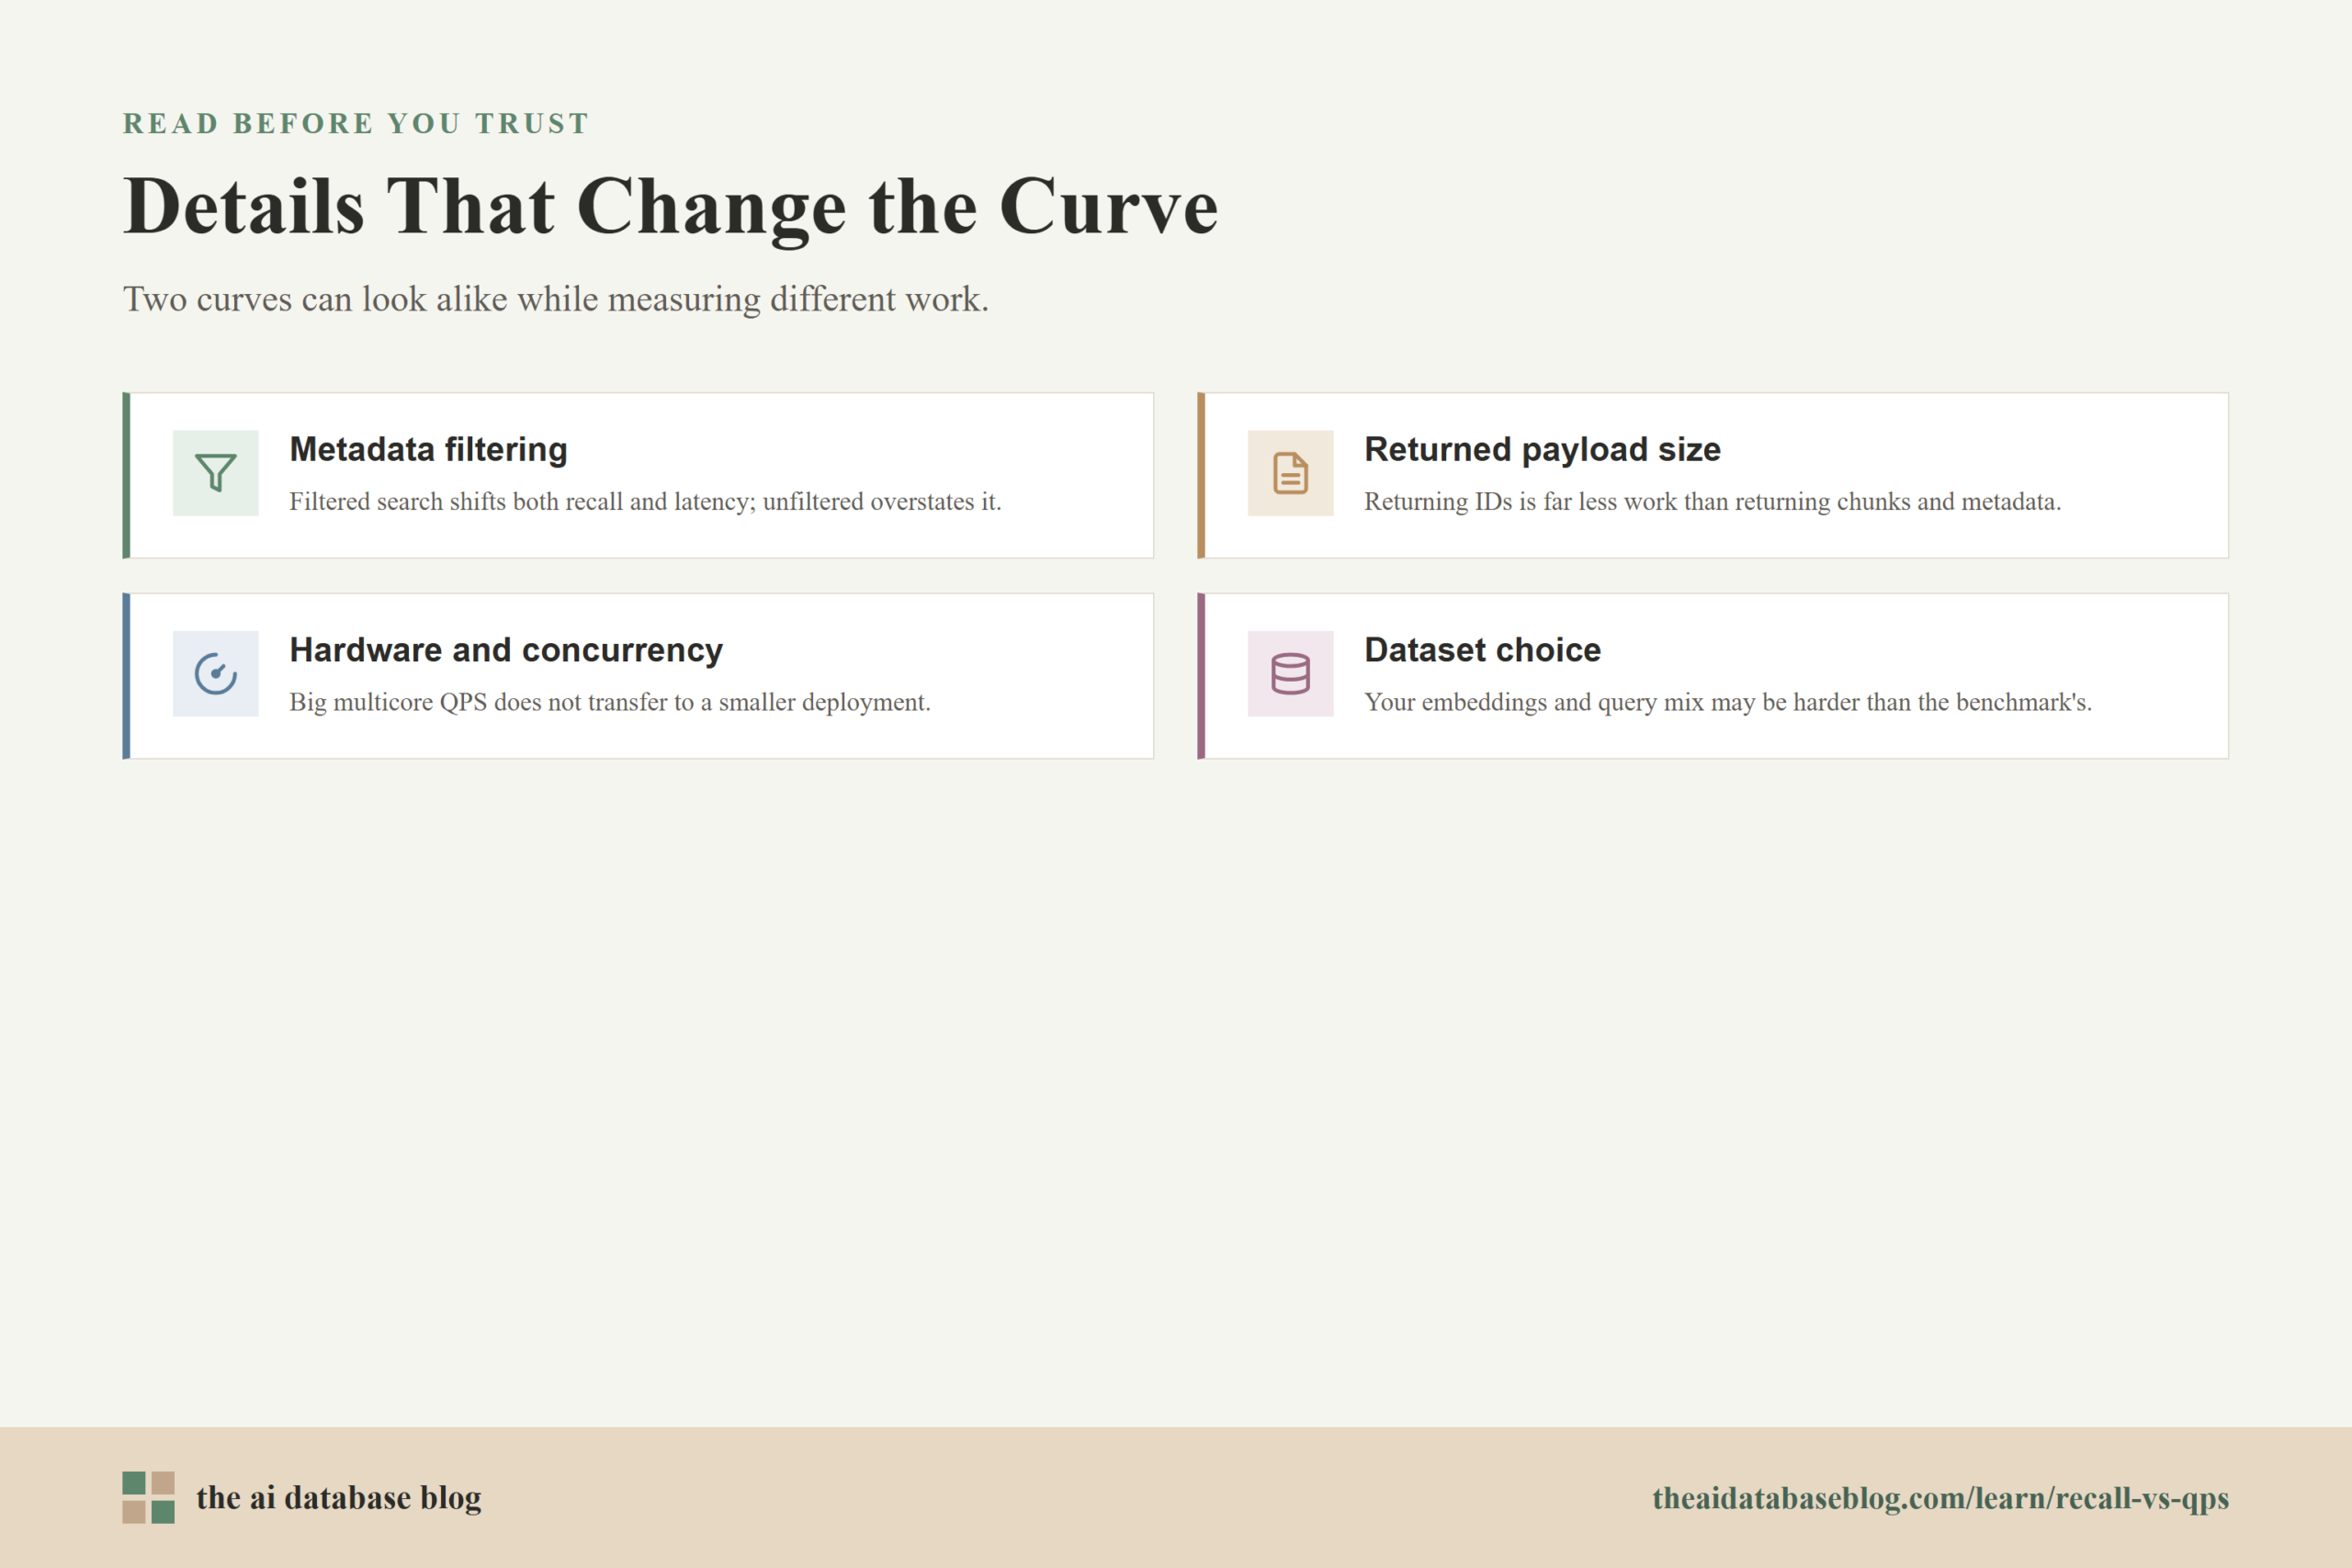
Metadata filtering is one of the most important details. Many clean vector search benchmarks measure unfiltered nearest-neighbor search, but production systems often filter by tenant, document type, language, permissions, date, region, or product category. Filtering can change both recall and latency depending on whether the system filters before search, during search, or after search. A benchmark that ignores filtering may overstate production performance for multi-tenant or permission-aware applications.
Returned payload size matters too. A benchmark that returns only vector IDs is measuring a smaller workload than a system that returns text chunks, titles, metadata fields, scores, and access-control data. For RAG applications, fetching and transferring the retrieved content can become part of the user-visible latency. This is why end-to-end latency is often more relevant than raw index lookup time.
Hardware and concurrency assumptions also shape the curve. A high QPS result on a large multicore machine does not translate directly to a smaller deployment. A single-thread benchmark may reveal algorithm efficiency but understate production throughput. A highly concurrent benchmark may reveal throughput but hide individual tail latency unless p95 and p99 are reported.
Dataset choice is another common trap. Simple public benchmark datasets are useful for repeatability, but they may not reflect the intrinsic difficulty of your embeddings, the way your users query, or the density of similar items in your corpus. A document retrieval corpus, an image embedding corpus, a product catalog, and an agent memory store can produce different recall and latency behavior even at the same vector count.
These details do not make benchmarks useless. They make benchmark reading more disciplined. Once you know which assumptions matter, you can use public results as a starting hypothesis and then test whether the same tradeoff holds for your application.
A Practical Checklist for Reading Recall and QPS Results
When you read an AI database benchmark, treat it as a structured evaluation rather than a headline number. The goal is to understand whether the reported results describe a workload that resembles yours and whether the tested configurations include a realistic operating point for your SLA.
- Check the recall definition. Confirm whether the benchmark reports recall@10, recall@100, or another value of k, and whether the ground truth was produced by exact search or another trusted method.
- Look at latency percentiles. Mean latency is useful, but p95 and p99 latency are better indicators of user-visible reliability under load.
- Compare points on the same curve. Do not compare QPS numbers across different datasets, top-k values, hardware, filters, or payload sizes unless those differences are clearly accounted for.
- Find the elbow. Look for the point where recall is high enough and additional quality gains become disproportionately expensive in latency or throughput.
- Inspect production features. Check whether the benchmark includes metadata filtering, tenant isolation, updates, deletions, reranking, hybrid search, and payload retrieval if those features matter to your system.
- Leave headroom. Choose a configuration that meets the SLA with margin, because real traffic includes spikes, uneven query difficulty, cache misses, and background work.
This checklist turns benchmark reading into a practical engineering step. Instead of asking which result wins in the abstract, you can identify which configurations are plausible candidates and which numbers are impressive but irrelevant.
Common Mistakes When Interpreting Benchmarks
The most common mistake is comparing best-case numbers from different benchmark setups. One result may use a small dataset, another may use more hardware, another may exclude network overhead, and another may return only IDs. Without matching the setup, the comparison becomes a mixture of system performance and benchmark design choices.
Another mistake is optimizing for maximum recall without considering whether the application benefits from it. If a downstream reranker, language model, or business rule layer only needs a reasonable candidate set, pushing from 97 percent recall to 99.5 percent recall may increase cost and latency without improving the final user outcome. On the other hand, for applications where missing a document has serious consequences, that extra recall may be worth the cost.
A third mistake is treating QPS as a substitute for latency. Throughput and latency are related, but they answer different questions. QPS asks how much traffic the system can carry. Latency asks how long a request waits. A system can have strong throughput while still producing unacceptable tail latency for some users.
The final mistake is ignoring the rest of the retrieval pipeline. Embedding generation, query rewriting, hybrid search, metadata lookup, reranking, content fetching, prompt assembly, and model generation can all affect the user experience. Vector search may be only one part of the total SLA, so its operating point should fit inside the larger application budget.
A good benchmark reading habit is therefore conservative and specific. Trust curves more than single numbers, trust production-like workloads more than synthetic ones, and trust your own SLA more than a generic claim of high performance.
FAQs
1. What does recall mean in a vector database benchmark?
Recall measures how many of the true nearest neighbors were returned by the approximate search system. In recall@10, for example, the benchmark checks how many of the true top 10 results appeared in the returned top 10 results. Higher recall means the system is preserving more search quality, but it often requires more work per query.
2. What does QPS mean in AI database search?
QPS means queries per second. It measures how many search requests a system can answer over time under a specific benchmark setup. QPS is useful for understanding throughput, but it must be interpreted alongside recall, latency percentiles, hardware, concurrency, top-k size, and filtering behavior.
3. Why does higher recall often reduce QPS?
Higher recall usually requires the search system to explore more candidates, scan more index regions, perform more distance calculations, or rerank more results. That extra work can improve result quality, but it consumes CPU, memory bandwidth, and time. On the same hardware, doing more work per query usually means serving fewer queries per second.
4. Is p99 latency more important than average latency?
For production systems, p99 latency is often more useful than average latency because it shows what happens to the slowest 1 percent of requests. Average latency can hide tail behavior that users still experience. If an application has a strict response-time SLA, p95 and p99 latency should be part of the benchmark review.
5. How should I choose a recall target?
Choose a recall target based on the retrieval task and the cost of missing relevant results. A casual semantic search feature may tolerate lower recall if it feels fast and useful. A RAG system that answers support, legal, financial, or technical questions may need higher recall because missing the right context can lead to weaker or incorrect answers.
6. Can public benchmarks predict production performance?
Public benchmarks can help you understand broad tradeoffs and compare general behavior, but they cannot fully predict production performance. Your dataset, embeddings, filters, result size, traffic pattern, hardware, and update rate can all change the curve. Use public benchmarks to narrow options, then run production-like tests before choosing an operating point.
Takeaway
Recall-versus-QPS benchmarks are most useful when they are read as trade-off curves rather than scoreboards. A single recall, latency, or throughput number hides too many assumptions to guide production decisions by itself. The practical goal is to choose an operating point that meets your recall target, stays inside your latency budget, supports your expected QPS, and reflects real workload details such as filtering and payload retrieval. This guidance is especially useful for teams building RAG systems, semantic search, recommendation pipelines, or agent memory stores where retrieval quality and response time both shape the user experience.