Monitoring an AI database means watching both system health and retrieval quality. Traditional database metrics such as latency, throughput, memory use, and storage growth are still essential, but they are not enough on their own. AI database teams also need to track whether search results remain relevant, whether recall is drifting, whether indexes are growing in ways that affect performance, and whether changes in data, queries, embeddings, or ranking behavior are degrading answers before users notice.
This guide explains how to monitor AI databases in production, especially vector search and retrieval systems used in AI applications. It covers the core metrics to track, how to think about alerting, what degradation looks like, and how teams can combine dashboards, traces, logs, evaluations, and synthetic tests into a practical observability setup.
Why AI Database Observability Is Different
AI database observability is different from ordinary database monitoring because the database is not only serving records. It is often deciding which context an AI system sees before generating an answer, recommending an item, finding a document, or matching a user query to semantically similar content. A query can return quickly and still be wrong if the retrieved results are stale, incomplete, poorly ranked, or semantically mismatched.
In a standard operational database, teams usually care about whether reads and writes are available, fast, and consistent enough for the application. In an AI database, those concerns still matter, but the system also has a relevance layer. A vector index can be healthy from an infrastructure point of view while the retrieval experience quietly becomes worse because user questions have changed, the corpus has shifted, metadata filters are excluding useful records, or a new embedding model no longer aligns well with older vectors.
This is why AI database observability needs two complementary views. The first view is operational: Is the system available, fast, scalable, and resource efficient? The second view is semantic: Is the system retrieving the right information for the questions users are asking? A mature monitoring approach watches both at the same time.
Once this distinction is clear, the rest of the monitoring strategy becomes easier to organize. Teams need metrics that describe how the service is behaving under load, and they need quality signals that describe whether retrieval is still useful. The next section breaks those signals into the metrics that matter most.
Key Metrics to Track
The best AI database dashboards are simple enough for daily use but detailed enough to explain failure. They should show whether the system is handling traffic, how long retrieval takes, how resource use is changing, how indexes are growing, and whether search quality is holding steady. Each metric should have an owner, a normal range, and a reason it exists.
It is tempting to monitor everything the database exposes, but too many disconnected charts make degradation harder to see. A better approach is to group metrics by the questions they answer. Is the user waiting too long? Is traffic rising? Is recall slipping? Is memory pressure increasing? Is index growth changing the cost or performance profile of the system?
Latency
Latency measures how long a query takes to return results. For AI databases, teams should usually track several latency views: end-to-end retrieval latency, vector search latency, keyword search latency when hybrid search is used, metadata filter latency, reranking latency, and full application latency when retrieval feeds a generation step.
Average latency is useful for a quick health check, but percentile latency is more important for production. P50 shows the typical experience, while P95 and P99 show what slower users experience. A retrieval system can look fine on average while a subset of users sees long delays because certain filters, namespaces, tenants, payload sizes, or query types are much more expensive than others.
Latency should also be tracked by query pattern. Short semantic search queries, filtered searches, hybrid searches, high top-k searches, and reranked searches can have very different performance profiles. Segmenting latency by query type helps teams avoid treating all slowdowns as the same problem.
QPS and Traffic Shape
QPS, or queries per second, measures how much query traffic the AI database is serving. It is a basic throughput metric, but it becomes much more useful when paired with latency and recall. A system that serves high QPS by lowering retrieval quality is not necessarily healthy, and a system that maintains quality only at low traffic may not be ready for production scale.
Teams should track sustained QPS, peak QPS, burst behavior, queue depth, and concurrency. The traffic shape matters because AI applications often have uneven load. A support assistant may spike during business hours, a recommendation system may spike after a campaign launch, and an internal knowledge tool may surge when a new policy or incident creates urgent questions.
QPS should also be segmented by tenant, application, index, query route, and read versus write behavior. When throughput rises, the important question is not only how much traffic exists, but where it is coming from and whether it changes the retrieval workload.
Recall and Recall Drift
Recall measures whether the system retrieves the relevant items that should be found. In AI database monitoring, recall is one of the most important quality metrics because retrieval failures often become answer failures downstream. If the correct context never reaches the application, a language model or ranking layer has less chance of producing a useful result.
Recall drift is the gradual decline of retrieval quality over time. It can happen when the corpus changes, when users ask new kinds of questions, when older embeddings no longer represent the content well, when chunking changes, when metadata becomes inconsistent, or when index parameters are tuned for speed at the cost of accuracy. Unlike latency, recall drift is often silent because the system may continue returning plausible results.
Production systems should measure recall with a maintained evaluation set whenever possible. This can include labeled queries, known relevant documents, curated test cases, difficult edge cases, and high-value user journeys. Teams can also track proxy signals such as click-through behavior, citation use, answer correction rates, abstention rates, result overlap, no-result rates, and changes in score distributions, but these proxies should not replace a real quality evaluation set.
Memory Usage
Memory usage is especially important for vector databases because indexes and embeddings can be memory intensive. The amount of memory needed depends on vector count, embedding dimensionality, numeric precision, index type, graph or partition overhead, cached data, metadata payloads, and query-time working memory. As the collection grows, memory pressure can turn into latency spikes, failed indexing, reduced throughput, or forced scaling.
Useful memory metrics include total memory used, memory per index, memory per tenant, cache hit rates, memory growth rate, and memory headroom. Teams should also watch whether memory usage changes after re-embedding, adding metadata fields, increasing top-k, changing index parameters, or introducing reranking that requires more candidate retrieval.
Memory alerts should be tied to both capacity and user impact. A high memory number is not always an incident, but rising memory combined with higher P95 latency, increased garbage collection, paging, or failed writes is a strong sign that the system is approaching a performance boundary.
Index Size and Index Health
Index size measures how large the searchable structure has become. In AI databases, index size is not just a storage concern. It affects build time, refresh time, memory requirements, query latency, backup size, restore time, and cost. A growing index can also expose weaknesses in earlier assumptions about embedding dimension, chunk size, metadata design, or partitioning.
Teams should track vector count, index storage size, index build duration, index refresh latency, deleted or stale object counts, compaction status, replication lag, segment counts, and ingestion backlog. If the application depends on fresh knowledge, index refresh latency is especially important because users may assume new data is searchable before it actually is.
Index health also includes the relationship between index settings and retrieval quality. Approximate nearest neighbor indexes are often tuned to balance speed, memory, and recall. A change that improves latency can reduce recall, and a change that improves recall can increase resource use. Monitoring should make those tradeoffs visible instead of treating index configuration as a one-time setup task.
These metrics give teams a useful baseline, but metrics alone do not create observability. The next step is to connect them into a model that explains what changed, where it changed, and why the user experience might be affected.
What Good Observability Looks Like
Good observability helps teams move from noticing symptoms to understanding causes. In an AI database, that means being able to follow a query through the retrieval path: request received, query embedded, filters applied, index searched, candidates returned, optional reranking performed, context selected, and response generated or handed back to the application. Each step should leave enough evidence to explain both slow performance and poor retrieval quality.
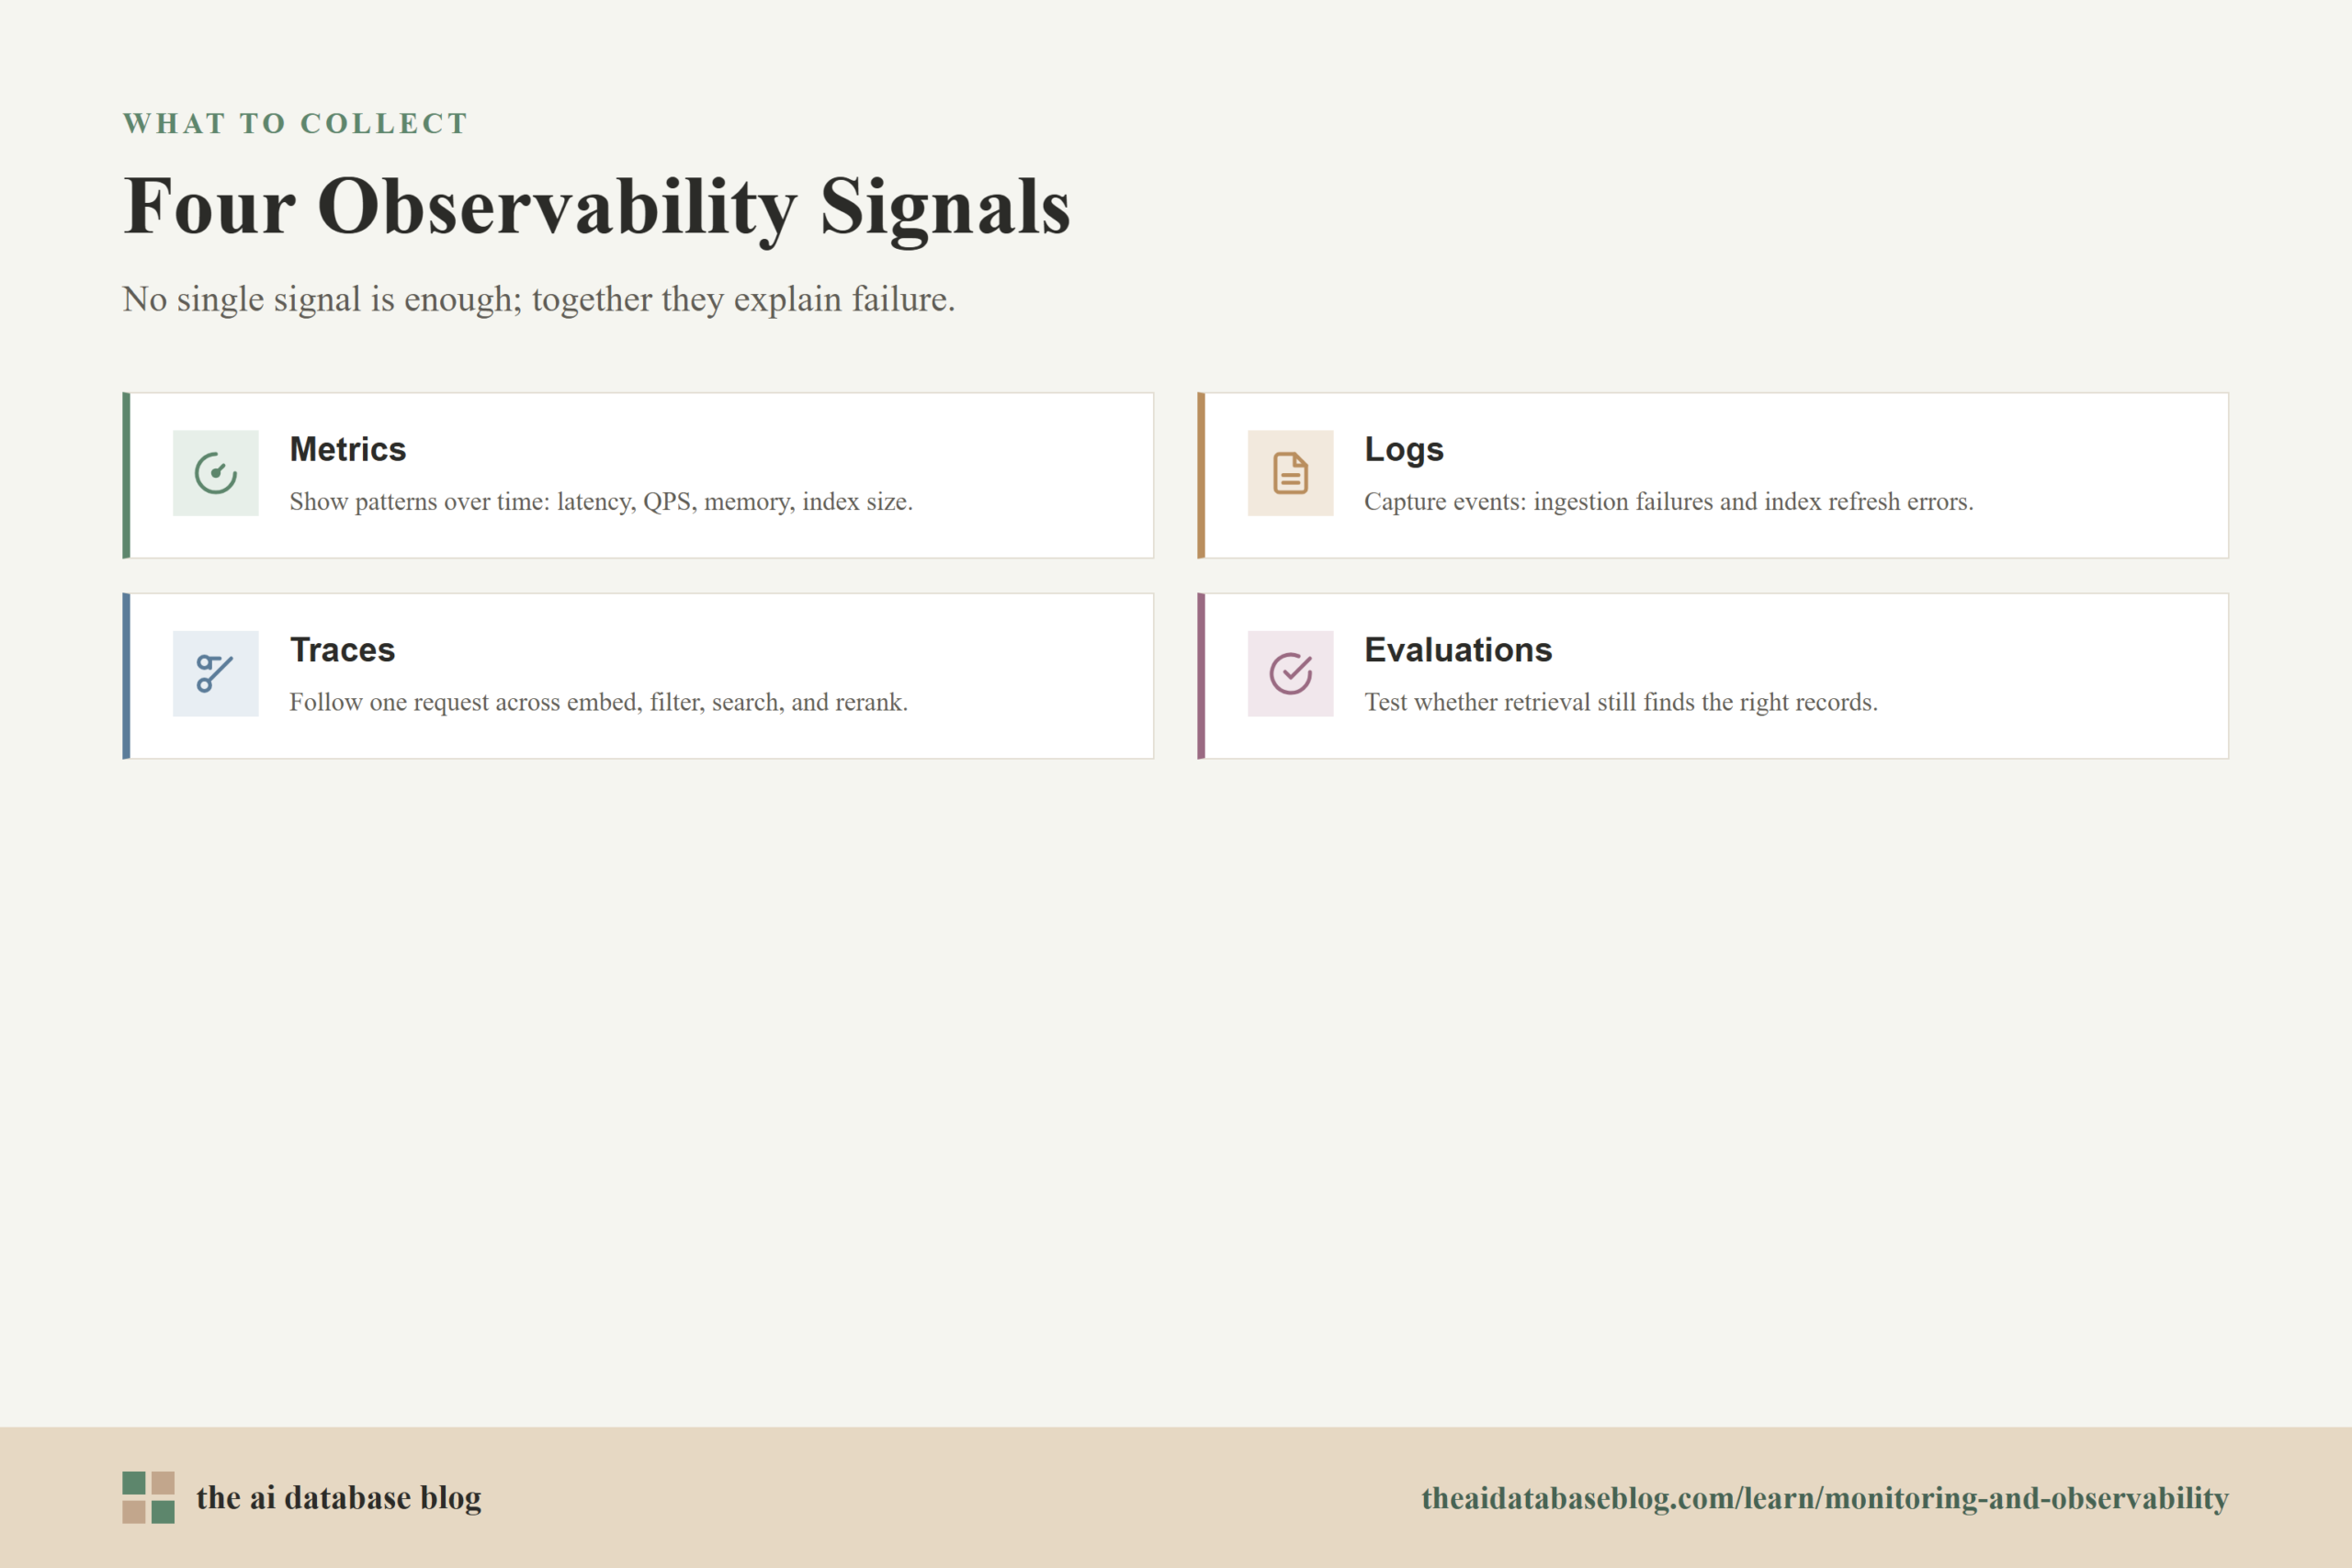
A practical observability setup usually combines metrics, logs, traces, and evaluations. Metrics show patterns over time. Logs provide event details, such as ingestion errors or index refresh failures. Traces show the path of individual requests across services. Evaluations measure whether retrieval is still finding the right content. None of these signals is enough alone, but together they make the retrieval system understandable.
Dashboards for Daily Health
Dashboards should show the current state of the system without requiring deep investigation. A useful first dashboard might include availability, P50/P95/P99 latency, QPS, error rate, memory use, CPU use, index size, ingestion backlog, index refresh latency, and recall on the latest evaluation run. This gives engineers, product teams, and operators a shared view of whether the system is healthy.
For larger systems, dashboards should be segmented by application, tenant, collection, index, query type, and environment. Segmentation matters because aggregate metrics often hide the real issue. A global latency chart may look stable while one tenant, filter pattern, or high-value query group is degrading.
Traces for Explaining Individual Failures
Traces are useful when a single request behaves badly. They can show whether time was spent generating an embedding, waiting on a database connection, applying filters, searching the vector index, reranking candidates, or passing retrieved context to another service. This is especially helpful when the application has multiple retrieval routes, such as hybrid search, fallback search, or tenant-specific indexes.
Trace attributes should include enough retrieval context to diagnose failures without exposing sensitive data. Examples include query route, index name, top-k value, filter count, candidate count, result count, embedding model version, retriever version, reranker version, and whether fallback behavior was triggered. These fields make it easier to compare successful and degraded requests.
Logs for Ingestion and Index Events
Logs are most useful for understanding events that do not fit neatly into a time-series chart. In AI databases, that often means ingestion failures, malformed metadata, embedding errors, failed deletes, duplicate objects, delayed index refreshes, schema changes, and re-embedding jobs. These events can create retrieval degradation even when query traffic looks normal.
For example, if recall drops after a document pipeline change, logs may show that a subset of documents was embedded with the wrong model version or indexed without required metadata. Without event-level records, the team may only see that search quality declined, not why it declined.
Evaluation Runs for Retrieval Quality
Evaluation runs are the quality counterpart to operational monitoring. They test whether the system retrieves the expected records for known queries. A strong evaluation set should include common queries, rare queries, ambiguous queries, recent-content queries, metadata-filtered queries, and queries where the system should return no useful result.
Retrieval evaluations should run before deployments, after index changes, after re-embedding jobs, and on a regular schedule in production. The goal is not to create a perfect score. The goal is to detect meaningful changes in recall, precision, ranking quality, and result coverage before those changes become user-visible problems.
With this observability foundation in place, alerting becomes more precise. Instead of waking someone up for every unusual number, alerts can focus on signals that imply user impact or likely degradation.
Alerting for AI Database Systems
Alerting should be designed around service-level expectations and retrieval-quality expectations. A good alert tells the team that something important has changed, gives enough context to begin investigation, and avoids constant noise. In AI databases, this means alerting on both operational failure and quality degradation.
Operational alerts are usually easier to define because they are tied to availability, latency, throughput, and resource limits. Quality alerts are harder because they depend on evaluation data, user behavior, and the meaning of relevance for the application. Both types matter because an AI database can fail by being unavailable, too slow, or quietly wrong.
Operational Alerts
Operational alerts should cover the metrics that directly affect service reliability. Common examples include elevated P95 or P99 latency, increased error rate, QPS above planned capacity, memory exhaustion risk, disk growth, indexing backlog, replication lag, failed ingestion jobs, and index refresh delays. These alerts help teams respond before the application becomes unusable.
Thresholds should be based on normal baselines and user expectations, not arbitrary numbers. For a conversational assistant, a one-second retrieval delay may be noticeable. For a nightly research workflow, it may not matter. Alert rules should reflect the application context.
Quality Alerts
Quality alerts should focus on retrieval degradation. Examples include recall falling below an agreed threshold on an evaluation set, a sudden increase in no-result queries, a large change in result score distributions, a drop in click or citation engagement, a rise in user corrections, or increased fallback usage. These signals can reveal that retrieval is less useful even when the system is technically healthy.
Quality alerting works best when teams maintain stable test sets and compare results across versions. If every evaluation changes at the same time as the system, it becomes difficult to know whether a drop is caused by the database, the data, the embedding model, the ranking logic, or the evaluation itself.
Alert Severity and Routing
Not every alert needs the same response. A full outage or fast-growing memory risk may require immediate action. A slow decline in recall may deserve a ticket, investigation, and scheduled remediation. An index size warning may be a capacity-planning issue rather than an emergency.
Routing should match ownership. Infrastructure alerts may go to platform or operations teams. Retrieval-quality alerts may go to the team responsible for relevance, data pipelines, or the AI application. In smaller teams, the same people may own both, but the alert should still describe whether the likely problem is operational, semantic, or pipeline-related.
Alerting catches visible risk, but teams also need methods for finding degradation that has not crossed a fixed threshold yet. That is where proactive detection becomes important.
Detecting Degradation Before Users Do
The hardest AI database failures are often gradual. A system can get slower by a few milliseconds each week, lose recall on newly added content, return more stale results, or become less reliable for a growing subset of queries. Users may not report the issue immediately. They may simply stop trusting the application, retry more often, or work around it.
Detecting degradation early requires baselines. A baseline is a known-good view of how the system behaves under expected load and expected data conditions. Once a team knows normal latency, recall, memory growth, index size, query mix, and result distribution, it can notice when the system starts drifting away from that state.
Use Synthetic Queries
Synthetic queries are controlled test queries that run regularly against the production or staging retrieval system. They should include important business questions, known edge cases, high-traffic query types, and recently added content. Because the expected results are known, synthetic tests can reveal retrieval failures before users encounter them.
For example, if a knowledge base is updated every day, synthetic queries can check whether yesterday’s new policy pages are retrievable today. If those queries fail, the problem may be ingestion delay, missing metadata, stale indexes, or an embedding pipeline issue.
Track Distribution Shifts
Distribution shifts happen when production behavior changes from the data the system was tuned on. In AI databases, this can include changes in query length, query language, topic mix, filter usage, embedding vector distributions, result scores, document types, or tenant traffic. These shifts are important because a retrieval system optimized for one workload may degrade when the workload changes.
Teams can detect distribution shift by comparing current production data with previous windows. A sudden rise in long queries, a new topic cluster, a drop in average similarity scores, or a spike in metadata-filtered searches may explain why latency or relevance changed. These signals do not always indicate a problem, but they tell teams where to look.
Watch Result-Level Signals
Result-level signals help teams understand whether retrieval output still looks healthy. Useful signals include result count, no-result rate, duplicate result rate, stale result rate, average and percentile similarity scores, score spread between top results, reranker score changes, and overlap between old and new result sets. These metrics are especially helpful after index tuning, re-embedding, chunking changes, or schema updates.
If a system suddenly returns fewer results for filtered searches, the issue may be metadata quality rather than vector search. If top results become more similar to each other, the system may be retrieving redundant chunks. If score distributions shift after an embedding model change, the team may need to recalibrate thresholds or rebuild evaluation baselines.
Compare Online Behavior With Offline Evaluation
Offline evaluations are controlled, but production behavior is messy. Online signals such as clicks, accepted answers, user corrections, retries, abandoned sessions, and support escalations can reveal gaps that a test set misses. The strongest monitoring programs compare both views.
If offline recall is stable but users are retrying more often, the evaluation set may not reflect current user questions. If user feedback is stable but recall tests are falling, the issue may affect lower-traffic queries that still matter. The comparison helps teams decide whether to update the evaluation set, investigate production data, or change the retrieval pipeline.
Early detection is easier when monitoring is connected to the way the AI database is built. The next section explains how to turn these ideas into a practical implementation rather than a scattered set of metrics.
How to Build a Practical Monitoring Setup
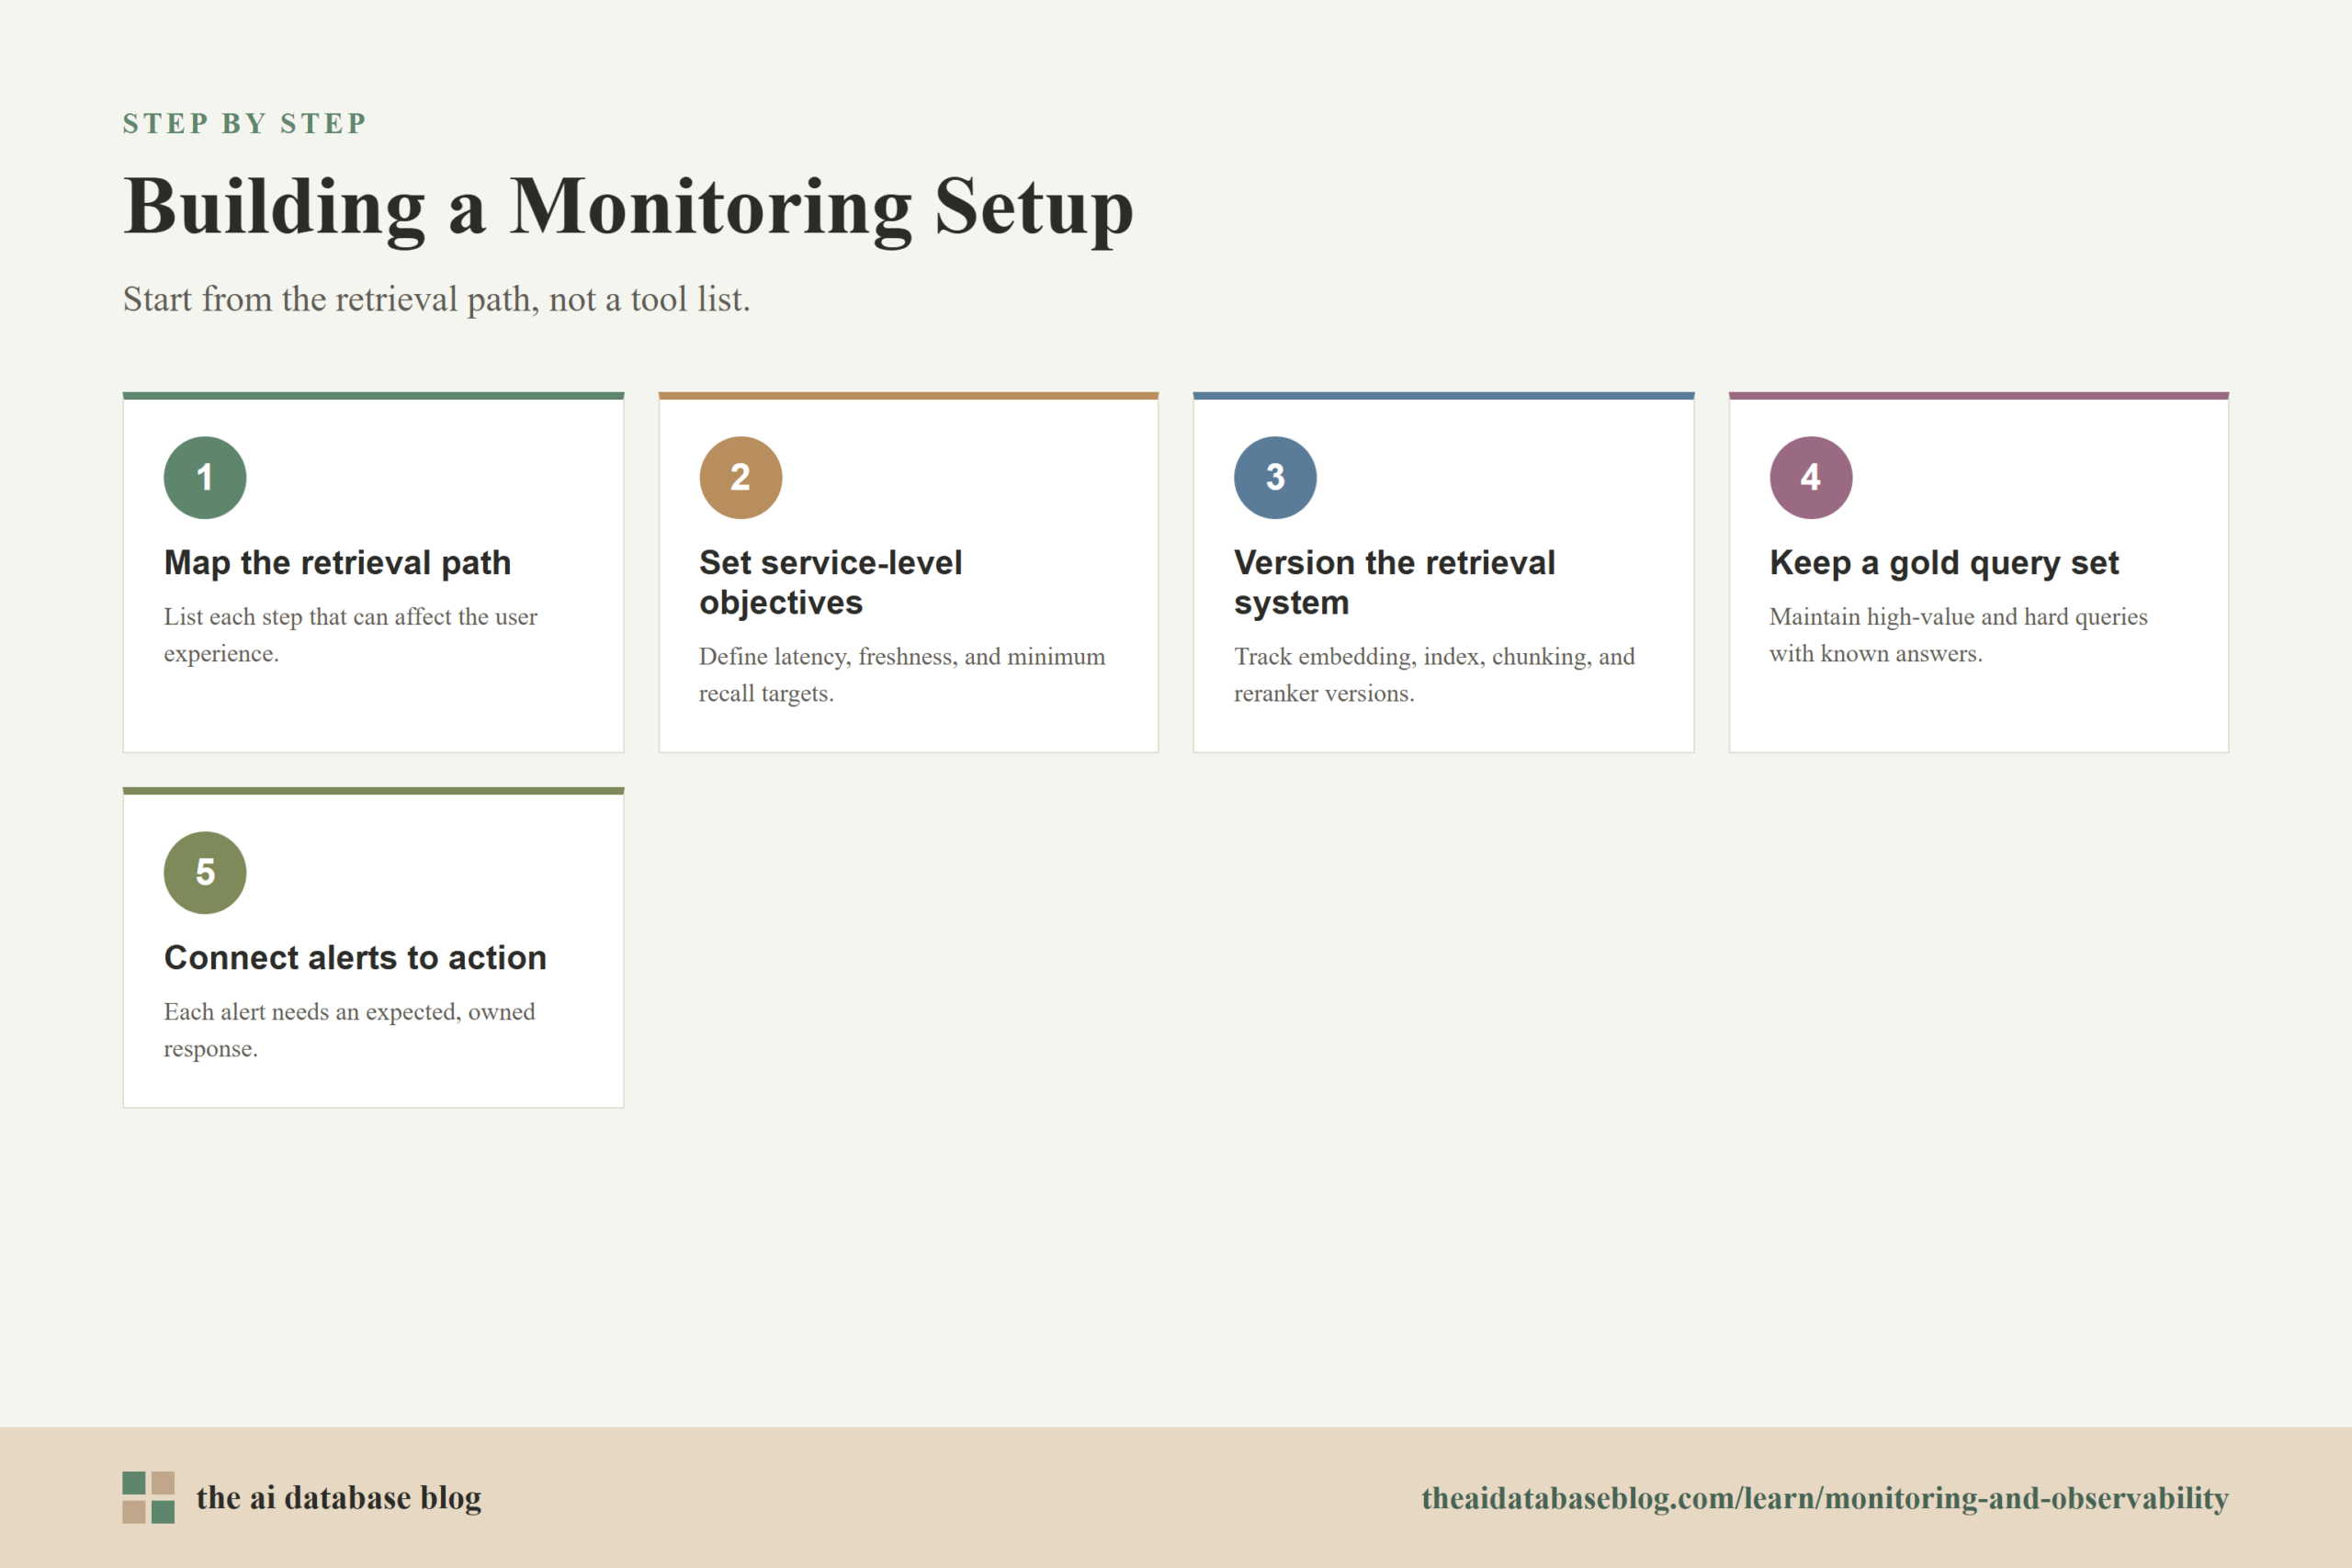
A practical monitoring setup starts with the retrieval path, not with a tool list. Teams should map each step that can affect the user experience: ingestion, embedding, indexing, query embedding, filtering, vector search, keyword search, reranking, context selection, and response generation. Then they should decide what metric, log, trace, or evaluation signal proves each step is working.
This approach keeps monitoring connected to real failure modes. Instead of collecting metrics because they are available, the team collects evidence for the questions it will need to answer during an incident or quality investigation. The result is usually simpler and more useful than a dashboard full of unrelated counters.
Start With Service-Level Objectives
Service-level objectives define what good service means. For an AI database, useful objectives might include retrieval availability, P95 latency, maximum index refresh delay, minimum recall on a gold test set, maximum ingestion failure rate, or required freshness for important content. These objectives give alerting and prioritization a clear basis.
The objectives should be realistic and tied to the application. A low-latency recommendation system, an enterprise search tool, and a batch research assistant will have different needs. The purpose of the objective is not to create a universal standard, but to make expectations explicit.
Version the Retrieval System
Versioning is essential for explaining quality changes. Teams should track the embedding model version, index configuration, chunking strategy, metadata schema, retrieval route, reranker version, and major corpus changes. When recall drops or latency rises, version information helps connect the symptom to a change.
Without versioning, teams may know that something degraded but not what changed. With versioning, they can compare behavior before and after a deployment, re-embedding job, schema migration, or index rebuild. This makes rollback and root-cause analysis much faster.
Keep a Gold Query Set
A gold query set is a maintained group of queries with expected relevant results. It does not need to be enormous to be useful. A small, carefully chosen set of high-value and difficult queries can catch many regressions that operational metrics miss.
The set should evolve as the product and corpus evolve. New user questions, new document types, and new failure cases should be added over time. The goal is not to freeze the system in the past, but to preserve known retrieval requirements while making room for new ones.
Connect Monitoring to Remediation
Monitoring is only useful if it leads to action. Each important alert should have an expected response, such as scaling capacity, reducing top-k, investigating memory growth, pausing an ingestion job, rebuilding an index, rolling back an embedding change, or reviewing failed query examples. If the response is unclear, the alert will create noise instead of improving reliability.
Teams should also review monitoring data after incidents and deployments. If an issue reached users without an alert, the monitoring strategy has a gap. If an alert fired but did not help diagnose the problem, it may need better context or routing.
At this point, the monitoring system covers operational health, retrieval quality, and actionability. The remaining challenge is to avoid common mistakes that make AI database observability look complete while still missing important failures.
Common Monitoring Mistakes
Many AI database monitoring problems come from treating retrieval systems like ordinary databases. The team watches latency, CPU, memory, and error rate, then assumes the system is healthy if those numbers are stable. That approach misses the most important AI-specific failure mode: the database can be fast, available, and wrong.
Another common mistake is relying only on user complaints. Users often do not report poor retrieval immediately. They may change their wording, distrust the tool, or stop using it. By the time feedback becomes obvious, the system may have been degrading for weeks.
Teams also struggle when they monitor quality without stable baselines. If the evaluation set changes constantly, the corpus changes constantly, and the retriever changes constantly, it becomes hard to tell whether quality improved or degraded. Good monitoring needs controlled comparisons, versioned changes, and enough historical data to identify trends.
A final mistake is separating infrastructure monitoring from relevance monitoring. Latency, QPS, memory, index size, and recall drift influence each other. Higher top-k may improve recall but increase latency. Aggressive index compression may reduce memory but lower quality. Larger indexes may improve coverage but increase refresh time. Observability should show these tradeoffs together.
Avoiding these mistakes does not require a perfect system. It requires a monitoring design that reflects how AI databases actually fail: through capacity pressure, data pipeline problems, changing user behavior, and silent retrieval-quality drift.
FAQs
1. What is the most important metric for AI database monitoring?
There is no single most important metric because AI databases need both operational and quality monitoring. Latency, QPS, memory, and index size show whether the system is performing reliably, while recall and recall drift show whether retrieval is still useful. For many production systems, the most important view is the combination of P95 latency and retrieval quality on a stable evaluation set.
2. How is recall drift different from latency degradation?
Latency degradation means the system is taking longer to return results. Recall drift means the system is becoming worse at finding the right results. Latency problems are often visible because users wait longer, while recall drift can be silent because the system may still return plausible but less relevant results.
3. How often should retrieval quality evaluations run?
Retrieval evaluations should run before major deployments, after index or embedding changes, after large ingestion updates, and on a regular schedule in production. The right frequency depends on how often the corpus and query patterns change. Fast-changing systems may need daily or even more frequent checks, while slower-changing systems may be fine with scheduled evaluations plus deployment gates.
4. Should AI database alerts use fixed thresholds or anomaly detection?
Both can be useful. Fixed thresholds work well for clear limits such as memory headroom, error rate, maximum index refresh delay, or a minimum recall target. Anomaly detection can help with changing patterns, such as unusual query volume, score distribution shifts, or sudden changes in no-result rates. The strongest setups often combine fixed service expectations with trend-based detection.
5. Why does index size matter if queries are still fast?
Index size matters because it affects future capacity, memory use, build time, refresh latency, backup and restore time, and cost. Queries may remain fast for a while, but a growing index can reduce headroom and make the system more fragile during traffic spikes or ingestion jobs. Monitoring index size helps teams plan before growth becomes a reliability problem.
6. What is the best way to detect degradation before users report it?
The best approach is to combine synthetic queries, stable evaluation sets, distribution-shift monitoring, and online behavior signals. Synthetic and evaluation queries catch known failure modes. Distribution monitoring shows when production behavior changes. Online signals such as retries, corrections, and abandoned sessions show where users may be losing trust.
Takeaway
AI database monitoring should cover both infrastructure health and retrieval quality. Readers should now understand why latency, QPS, memory, index size, and recall drift need to be monitored together, how alerting can separate operational problems from semantic degradation, and how synthetic tests, evaluation sets, traces, logs, and distribution tracking help teams detect issues before users do. This guidance is most useful for teams running vector search, hybrid search, RAG, enterprise search, or recommendation systems where the database is responsible not just for returning results, but for returning the right results reliably.